Blog List

Monday, 5 December 2016

The social production of design space

Published Date
September 2016, Vol.46:199225, doi:10.1016/j.destud.2016.06.002

Author 
  • Frederick M.C. van Amstel ,1,
  • VISICO Center, Department of Construction Management & Engineering, University of Twente, P.O. Box 217, Enschede, The Netherlands
  • Timo Hartmann
  • Civil Engineering Institute, TU Berlin, Gustav-Meyer-Allee 25, Gebäude 13b, Berlin, Germany
  • Mascha C. van der Voort
  • Laboratory of Design, Production and Management, University of Twente, P.O. Box 217, Enschede, The Netherlands
  • Geert P.M.R. Dewulf
  • VISICO Center, Department of Construction Management & Engineering, University of Twente, P.O. Box 217, Enschede, The Netherlands
The production of design space refers to the activity of an individual or a group of individuals considering alternatives and possibilities for a design brief. Design studies often consider constraints to be a major determinant of design space, yet this paper introduces the notion of contradiction to underscore a dialectical determination of design space. The intention here is to characterise the production of design space as a socio-material rather than a cognitive process. This is accomplished through an in-depth look at a medical imaging centre project and an experiment with design students about the same project. In comparison to the original project, the students' activity reproduced the same contradictions faced by practitioners.

Keywords

  • design activity
  • parametric design
  • architectural design
  • design space
  • case study

  • Figure 1.
    Figure 2.
     Table 1
    Table 1.
    Figure 3.
    Figure 4.
    Figure 5.
    Figure 6.
    Figure 7.
    Figure 8.
     Table 2
    Table 2.
    • ∗ 
      Corresponding author: Frederick M.C. van Amstel

    For further details log on website :
    http://www.sciencedirect.com/science/article/pii/S0142694X15301368

    Collaborative product design processes of industrial design and engineering design in consumer product companies

    Published Date
    September 2016, Vol.46:226260, doi:10.1016/j.destud.2016.06.003

    Author 
    • KwanMyung Kim
    • Graduate School of Creative Design Engineering, Ulsan National Institute of Science and Technology, 50 UNIST-gil, Ulsan, 44919, Republic of Korea
    • Kun-pyo Lee ,
    • Department of Industrial Design, Koreas Advanced Institute of Science and Technology, 291 Daehak-ro, Daejeon, 34141, Republic of Korea


    Highlights

    This study aims to elucidate how industrial designers and engineering designers collaborate, and how such an alliance reflects in the design process. We conducted in-depth interviews about actual product design projects with 34 industrial and engineering designers from six consumer product manufacturers. We firstly identified individual design processes from the interview data. Secondly, we then compared and merged the design processes into collaborative processes using a mosaic method. We finally simplified the collaborative processes to create representative process models. As a result, we discovered four types of typical collaborative product design processes and their characteristics – Type 1: ID-led Concept-driven Process, Type 2: ID-led Combined Outside-inside Process, Type 3: ED-led Inside-first Process, and Type 4: ID&ED Synergetic Process.

    Keywords

  • design process modelling
  • collaborative design
  • product design
  • industrial design
  • engineering design

  • Figure 1.
     Table 1
    Table 1.
     Table 2
    Table 2.
    Figure 2.
    Figure 3.
    Figure 4.
    Figure 5.
     Table 3
    Table 3.
    Figure 6.
    Figure 7.
    Figure 8.
    Figure 9.
    • ∗ 
      Corresponding author: Kun-pyo Lee


    For further details log on website :
    http://www.sciencedirect.com/science/article/pii/S0142694X16300382

    We can harvest bioenergy from preserves while protecting biodiversity

    Published Date
    2016, Nov 30

    By
    Frontiers Focus

    Koenraad Van Meerbeek, a researcher in the Departement Aard- en Omgevingswetenschappen (Earth and Environmental Sciences) at Katholieke Universiteit Leuven, Belgium, shares this Frontiers Focus on the potential of Natura 2000 preserves to contribute biomass for bioenergy, without losing  biodiversity.

    White-winged Terns (Chlidonias leucopterus) take flight from a meadow in Biebrza National Park, a Natura 2000 site (PLB200006) in Poland. Credit, Frank Vassen CC BY 2.0.
    White-winged Terns (Chlidonias leucopterus) take flight from a meadow in Biebrza National Park, a Natura 2000 site (PLB200006) in Poland. Credit, Frank Vassen CC BY 2.0.
    Renewable energy from biomass, i.e. “bioenergy,” holds promise for climate change mitigation, but converting big tracts of land to bioenergy crops can have bad effects on biodiversity. This is a critical concern, because ecosystems need a rich variety of species to function. People rely on functioning ecosystems for food production, water and air purification or flood control. And bioenergy requires a lot of land.
    My colleagues and I believe that climate change and biodiversity mitigation, two of the world’s most challenging problems in the 21st century, need not be at odds. We show how the vast bioenergy potential of the European nature conservation network Natura 2000 could be exploited, while still protecting and restoring biodiversity, in the November issue of ESA Frontiers.
    Drawing on the 78 million hectares of protected lands in the Natura 2000 network for bioenergy feedstock relieves pressure to displace food production on agricultural lands – which risks raising food prices for vulnerable people. We believe we can harvest feedstock on protected lands without compromising biodiversity goals.
    The key strategy to preserve biodiversity has been the establishment of protected areas. But protecting land is not enough to halt biodiversity loss. Some of the most threatened habitats need consistent human intervention, because the environmental conditions that once maintained them have been so changed by human development. Many familiar European ecosystems were shaped by centuries of farming and grazing livestock. We estimate that 7.5 million hectares, or about 10 percent, of the Natura 2000 lands consist of semi-natural, open ecosystems.
    To preserve these species-rich grasslands, wetlands and heathlands, some kind of management, like mowing, grazing or sod-cutting, is necessary. We advocate for such conservation methods in Natura 2000’s protected areas, and see an opportunity to harvest bioenergy feedstock sustainably. Existing technology can process into fuel highly diverse biological materials, like the mix of grasses in a wild meadow.
    Nature management is all too often regarded as a cost. We show that it can an opportunity to produce a more sustainable feedstock alternative for the currently-used energy crops.


    november-frontiers-coverKoenraad Van Meerbeek, Sam Ottoy, MarĂ­a de AndrĂ©s GarcĂ­a, Bart Muys, Martin Hermy (2016) The bioenergy potential of Natura 2000 – a synergy between climate change mitigation and biodiversity protectionFront Ecol Environ 14(9):473–478, doi:10.1002/fee.1425

    For further details log on website :
    http://www.esa.org/esablog/research/bioenergy-biodiversity-natura-2000/

    Risk analysis finds savings for homeowners and local governments of excluding invasive pests like the emerald ash borer outweigh added cost to imported goods

    Published Date
    Jun 6 2014

    By Liza Lester

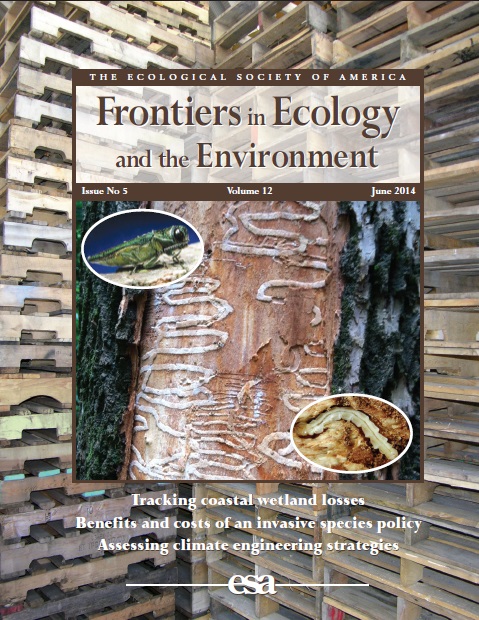
    June 2014 cover for Frontiers in Ecology and the Environment featuring the emerald ash borer.
    The emerald ash borer (top circle) inflicts lethal damage on native North American ash trees (center) in its larval form (bottom).
    Credits, tree, K Oten;  insects, D Cappaert; Michigan State University, Bugwood.org. Background pallets, USDA Forest Service, Bugwood.org.
    The emerald ash borer (Agrilus plantipenis), a recent insect immigrant to North America carried in with the wooden packing material of imported goods, is projected to cause over a billion dollars in damages annually over the next decade. International standards now require expensive fumigation or heat treatment of wood pallets and crates to prevent the inadvertent import of new wood boring insect pests in shipping materials.
    Preventative treatment is worthwhile when the cumulative damages of widening infestations are considered, report scientists in Ecological Society of America’s journal Frontiers in Ecology and the Environment. Their cover story in the June 2014 issue is the first pathway-level risk assessment of the net benefits of current international phytosanitary policy.
    The emerald ash borer is already established throughout much of Michigan and areas of Illinois Indiana, Ohio, Pennsylvania, and Ontario, Canada. Some critics have argued that investments in pest management are not justified because prevention can only delay invasions, and, unlike the emerald ash borer, many introduced species do not cause substantial damages.  But there is an economic net benefit to preventing or delaying the introduction of the emerald ash borer to parts of the US that do not yet harbor it.
    “Even when these factors are considered and incorporated along with the best available scientific data into our models, there is an expected economic net benefit to preventing or delaying the introduction of new pests, a few of which may be as bad or worse than the emerald ash borer,” said lead author Brian Leung, an ecologist at McGill University in Montreal, Canada. “Treatment reduces the risk of low probability, but highly damaging, events, much like an insurance policy, or mitigation of natural disasters.”
    Global trade unintentionally moves living species around the world in packing materials, ballast water, and on live nursery plants. Most of these accidental immigrants are harmless, but a small number that prove problematic can have outsized costs. The emerald ash borer, a native of Southeast Asia and Eastern Russia, lacks predators in North America and has spread quickly, killing millions of ash trees since its discovery near Detroit, Mich.
    Emerald ash borer larvae feed on the cells of the tree’s nutrient and water transport systems. Eventually, water and nutrients no longer flow to the tips of the branches, and the tree dies.
    For their risk analysis, Leung and colleagues drew on a study of the “Effectiveness of the International Phytosanitary Standard ISPM No. 15 on reducing wood borer infestation rates in wood packaging material entering the United States,” published last month in the journal PLoS ONE by coauthor Robert Haack (press release), that found that implementation of ISPM15 treatment standards reduced wood borer infestation rates by up to 52%.
    “Here we’re just talking about economic costs. These analyses have not incorporated the non-market, or ecological, values of the trees, so the benefits are even greater than our calculations,” said Leung.
    Although preventative treatment is not 100% effective and the up-font cost is high, Leung and colleagues estimate that the economic benefits of slowing the introduction of wood boring insect pests will accumulate a net benefit of $11.7 billion, taking into account benefits minus costs through 2050. They project annual benefits to exceed costs by 2016, and cumulative net benefits to be in the black by 2024.
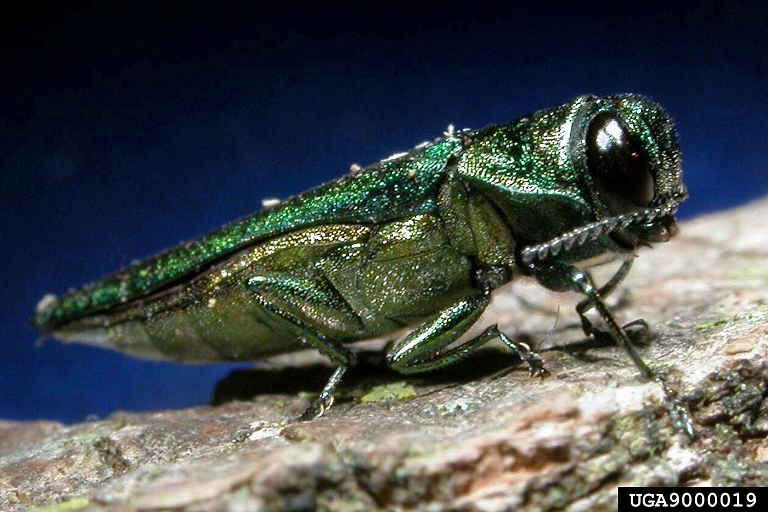
    An adult emerald ash borer (Agrilus plantipenis). Credit, K Oten.
    An adult emerald ash borer (Agrilus plantipenis). Credit, K Oten.
    ISPM15, implemented in the United States beginning in 2005-6, requires that all wood packaging materials of greater than 6 millimeters thickness shipped between 70 signatory countries be debarked and then heated or fumigated with methyl bromide. A stamped seal on treated pallets and crates marks compliance. Treatment costs about $1.50 per pallet, amounting to an estimated $437 million in up-front costs (calculated in 2004 dollars). Treated pallets can be recycled, however, and have an average lifespan of six years.
    Economists often focus on the costs of infestation for the forestry industry. But the expense of removing and replacing dead trees mostly falls on homeowners and local governments.
    “The people who experience the majority of the damages of invasive pests are not generally the people who benefit the most from the imports,” said Leung. “The costs of invasive pests are very unevenly distributed.”
    Ash trees (Fraxinus spp.) line city streets and fill agricultural windbreaks throughout much of North America — 38 million landscape trees in the 25 states surrounding Detroit, according to US Forest Service estimate. Ash species are important constituents of native forest ecosystems, particularly the hardwood forests of the east and ash wood is popular for bows, baseball bats, firewood, and electric guitar bodies.
    “Sometimes you don’t have a choice to manage pests once they’re here. You can’t leave a dead tree to fall on someone’s house,” said Leung. “So even though preventative treatment is expensive and doesn’t keep out 100% of wood borers, when you incorporate all the data, this preventative policy is still worth it. ISPM15 could probably be more effective, but we should not underestimate the benefits of even delaying the arrival of new pests, which may avoid the cost of another emerald ash borer for a generation.”


    • Brian Leung, Michael R. Springborn, James A. Turner, and Eckehard G. Brockerhoff (2014). Pathway-level risk analysis: the net present value of an invasive species policy in the USFrontiers in Ecology and the Environment 12(5): 273-279 http://dx.doi.org/10.1890/130311
    • Haack RA, Britton KO, Brockerhoff EG, Cavey JF, Garrett LJ, et al. (2014) Effectiveness of the International Phytosanitary Standard ISPM No. 15 on Reducing Wood Borer Infestation Rates in Wood Packaging Material Entering the United States. PLoS ONE 9(5): e96611. doi:10.1371/journal.pone.0096611
    The Nature Conservancy, the National Center for Ecological Analysis and Synthesis (under NSF grant #DEB-0553768), the University of California, Santa Barbara, and the State of California funded this study.

    For further details log on website :
    http://www.esa.org/esablog/research/slowing-the-insect-invasion-wood-packaging-sanitation-policy-yields-us-11-7-billion-net-benefit/

    Intraspecific Relationships among Wood Density, Leaf Structural Traits and Environment in Four Co-Occurring Species of Nothofagus in New Zealand

    Published Date

    Author


    Abstract

    Plant functional traits capture important variation in plant strategy and function. Recent literature has revealed that within-species variation in traits is greater than previously supposed. However, we still have a poor understanding of how intraspecific variation is coordinated among different traits, and how it is driven by environment. We quantified intraspecific variation in wood density and five leaf traits underpinning the leaf economics spectrum (leaf dry matter content, leaf mass per unit area, size, thickness and density) within and among four widespread Nothofagus tree species in southern New Zealand. We tested whether intraspecific relationships between wood density and leaf traits followed widely reported interspecific relationships, and whether variation in these traits was coordinated through shared responses to environmental factors. Sample sites varied widely in environmental variables, including soil fertility (25–900 mg kg–1 total P), precipitation (668–4875 mm yr–1), temperature (5.2–12.4 °C mean annual temperature) and latitude (41–46 °S). Leaf traits were strongly correlated with one another within species, but not with wood density. There was some evidence for a positive relationship between wood density and leaf tissue density and dry matter content, but no evidence that leaf mass or leaf size were correlated with wood density; this highlights that leaf mass per unit area cannot be used as a surrogate for component leaf traits such as tissue density. Trait variation was predicted by environmental factors, but not consistently among different traits; e.g., only leaf thickness and leaf density responded to the same environmental cues as wood density. We conclude that although intraspecific variation in wood density and leaf traits is strongly driven by environmental factors, these responses are not strongly coordinated among functional traits even across co-occurring, closely-related plant species.

    Introduction

    Consistent correlations among plant traits, and between plant traits and environment, are the basis for defining and interpreting plant strategies [1][3]. Interspecific correlations among leaf traits and their relationships with the environment have been thoroughly documented [4][6]especially those contributing to the ‘leaf economics spectrum’ [2]. Although there is clear evidence for consistent trait correlations and trait syndromes among species, these have not been rigorously tested within species. Recent studies have revealed that intraspecific variation is a major component of trait variation, both within and among communities, more so than previously supposed [7][12]. Intraspecific and intrageneric studies are a strong test of the functional link between traits [13][14] because they avoid the problem of trait associations derived from shared ancestry and fortuitous trait divergences [15]. Further, as different mechanisms may constrain trait–trait combinations within species to those widely observed among species [16][17], studies of both inter- and intraspecific variation are valuable for gaining a comprehensive view of the drivers of trait variation. Similarly, intraspecific studies of trait–environment relationships complement studies of trait variation among communities as these are confounded by species turnover along environmental gradients [18][20]. Intraspecific correlations among plant traits and with environment have great promise for revealing functional associations among traits, and between traits and the environment [19][21].
    Leaf mass per unit area (LMA) forms the backbone of the leaf economics spectrum because it integrates several aspects of leaf construction including leaf dry matter content (LDMC), tissue density and leaf thickness [4][5][22]. LMA is also closely linked to leaf-level processes such as photosynthetic rate, as well as whole-plant performance [23]. Although LMA and its component traits are typically intercorrelated, the individual components of LMA can also vary somewhat independently, reflecting their specific functions and responses to the environment [4][24][26]. LMA is strongly linked to photosynthetic rates through the influence of leaf thickness and leaf density on leaf volume and intercellular resistance to CO2 conductance, respectively [4]. LDMC and leaf density have been advocated as better predictors of plant performance along resource gradients than LMA, because they are more direct measures of leaf construction and allocation [5][24][26]. Given the unique functions of each component trait, we propose that the relationships between each leaf trait and other plant functional traits (e.g., stem and root traits) cannot be generalised from LMA alone. Further, leaf trait responses to environment are likely to vary according to the specific function of each component trait of LMA. In this study, we test the consistency of relationships between leaf traits and wood density – a key stem trait – within species using several component traits of the leaf economic spectrum rather than solely LMA.
    Interspecific leaf trait variation has been linked to variation in roots [15][27] and stems [28] in an attempt to define whole-plant axes of trait variation [3]. Wood density is one of the more widely studied stem traits [29][30] as it is an easily measured estimate of resource allocation to structural support. Despite the expectation that leaf and wood traits should be closely coupled along a spectrum of plant strategies from fast-growing, resource-acquiring species with low investment in leaf and wood tissues to slow-growing, resource-conserving species with high investment [28][29], relationships between wood density and leaf traits are complex and often point to orthogonal rather than parallel axes of variation. However, many studies report that species having dense wood also have relatively small leaves [31][34]. This has been interpreted as an adaptation to water limitation, with smaller leaves and higher wood density both promoting greater water use efficiency [35][36]. Hence, traits are correlated through a shared link to an environmental factor. Shared responses to environment drive correlations between traits, leading to shifts in trait syndromes along environmental gradients. High LMA is sometimes associated with high wood density [37][39], but non-significant relationships have also been reported [36][40][41]. Correlations between wood density and the component traits underpinning LMA (i.e., LDMC, leaf size, leaf thickness and leaf density) have received relatively little attention but indicate that species with a high wood density also have high LDMC [37][42] while relationships with leaf density and thickness are less clear.
    The two studies linking intraspecific variation in wood density and LMA have reached contradictory conclusions. There was no relationship between LMA and wood density for Pinus sylvestris sampled across Europe [19], whereas LMA and wood density of Nothofagus pumiliowere correlated across sites, but not within individual sites along elevation gradients [21]. Intraspecific relationships between wood density and other component leaf traits of LMA have not been investigated either within communities or across wide environmental gradients.
    We quantified intraspecific variation in wood density and five leaf traits that underpin the leaf economics spectrum within four species of Nothofagus throughout the South Island of New Zealand. Our sampling quantified intraspecific trait variation of Nothofagus species both within and among 30 sites, and encompassed wide environmental variation along both latitudinal and altitudinal gradients. Nothofagus is the most abundant tree genus in New Zealand forests, is common throughout the Southern Hemisphere and is ideal for evaluating the extent of intraspecific variation under natural conditions at large (i.e., >700 km) spatial scales. We first test whether LMA and the component leaf traits contributing to LMA show consistent relationships with wood density within each species. We specifically test whether the widely reported interspecific relationships between wood density and leaf traits are upheld within species. We then examine whether wood density and each of the five leaf traits share common responses to environmental variation. Finally, these data are used to evaluate whether LMA is a functional surrogate for the underpinning component traits, or whether each leaf trait exhibited distinctive functional responses to variation in wood density and the environment.

    Methods

    Site and species selection

    We sampled the four evergreen Nothofagus species found in New Zealand – N. menziesii(Hook.f.) Oerst., N. fusca (Hook.f.) Oerst., N. solandri (Hook.f.) Oerst. and N. truncata(Colenso) Cockayne. N. solandri is treated here as a single species without distinction between its two commonly recognised varieties (N. solandri var. solandri and N. solandri var. cliffortioides (Hook.f.) Poole), as these hybridise abundantly [43] and many intermediate forms were sampled here. All species are common and widespread [44], long-lived (250–600 years), and often dominate forest communities [45]N. truncata has the narrowest environmental niche, being confined to low fertility soils and sites with a mean annual temperature (MAT) of ≥ c. 9 °C [45][46]N. fusca is widespread and excluded only from the coolest (< c. 6.5 °C) and driest (< c. 600 mm mean annual rainfall, MAR) sites. Nmenziesii and Nsolandri have wide environmental niches and occur from sea level to treeline (MAT c. 5 °C) [45][46]. We sampled Nothofagus at 30 sites throughout the environmental diversity of southern New Zealand (Fig. 1Table S1). Sites were selected to capture the full range of environments encountered by each Nothofagus species. Sites were visited during March–April 2010 (late austral summer) to sample stem wood, canopy leaves and mineral soil. We sampled 9–11 canopy trees of each Nothofagus species at each site, ranging in diameter at breast height from 51 to 785 mm. Sampled areas were <1000 m2 (c. 30×30 m) and were selected to be homogeneous, with minimal local variation in soil fertility due to microtopography.
    thumbnail
    Figure 1. Distribution of four Nothofagus spp. in New Zealand and sampling locations for six functional traits.
    Sampling locations (filled circles) are shown relative to modelled distributions [71] in grey shading for (a) N. solandri (b) N. menziesii (c) N. fusca and (d) N. truncata.

    Plant traits

    All individuals sampled were canopy trees with fully illuminated foliage. All trait measurements followed standard protocols [47]. For foliar traits we used 8–12 leaves from each individual of each species at each site to measure: leaf dry matter content (LDMC, mg g–1) as the ratio of oven-dried (at 60 °C for 48 h) leaf mass to fully saturated leaf mass (leaves were removed from branches, placed between moist tissue paper and stored in sealed plastic bags in a fridge overnight); leaf thickness (mm) of the lamina (avoiding the midrib) measured using a Measumax digital micrometer; fresh leaf area (mm2), using Winfolia and an Epson flatbed scanner (Epson Corporation, Nagano, Japan); leaf mass per unit area (LMA, g m–2) as the ratio of dry mass to fresh leaf area; and leaf density (mg mm–3) as the ratio of dry mass to fresh leaf volume (fresh leaf area × thickness). Canopy leaves were sampled using a shotgun. We used the mean of the 8–12 leaves from each individual in all analyses. One wood density (oven-dry mass divided by green volume, kg m–3) sample was taken at breast height (1.35 m). For stems with dbh ≥ 120 mm, we used a 21-mm auger to sample each individual through to the stem centre. The depth of the augured hole was measured to the nearest millimetre and the volume of the hole calculated as a cylinder. Wood density of stems with dbh of 51–120 mm was measured on stem discs that were kept moist prior to cutting a regular volume in the laboratory using a bandsaw. All wood samples were air-dried (up to 2 months) and then oven-dried (70 °C) over several weeks until a stable mass was obtained. A small number of stems of two species in the dbh range of 80 to 120 mm were measured using the auger and these were compared to samples collected using discs to assess whether the sampling method affected estimates of wood density, while accounting for stem dbh. There was no statistical evidence that sampling method affected wood density in N. menziesii (General Linear Model, F1,8 = 0.01, P = 0.948) or N. solandri (General Linear Model, F1,13 = 2.32, P = 0.152).

    Climate and soil chemistry

    MAT and MAR for each site were modelled using thin-plate splines fitted to data from nearby meteorological stations [48]. Elevation was taken from a topographic map. Soil nutrient availability (total P) was estimated from a pooled mineral soil sample at each site. Five mineral soil (0–100 mm) subsamples were collected systematically from each site with a corer of 65-mm internal diameter. These subsamples were pooled per site and air-dried, sieved through 2-mm mesh, and used for measurement of gravimetric soil water content and total P (ignition and dissolution in 0.5 M sulphuric acid). Results are expressed on an oven-dry-soil (105 °C) basis. Soil total P is used as a single measure of soil nutrient availability as it has demonstrated relationships in New Zealand with forest community composition [49], plant nutrient use efficiency [50] and functional trait spectra [15].

    Statistical analyses

    Plant traits can vary with ontogeny [51] and to remove size-related variation in each trait before testing for trait-trait and trait-environment correlations, we used a general linear model to determine the relationship between tree diameter at breast height and each trait within each species. The residuals from these models were used in all subsequent analyses. Pearson's correlations were run for each trait-trait and trait-environment relationship within each species. Statistical significance of each correlation was assessed after Holm-Bonferroni correction tests for multiple comparisons. All traits were log-transformed prior to analysis, to meet assumptions of normality and to linearise trait–trait and trait–environment relationships. In addition to MAT, MAR and soil P, we included elevation and latitude as indirect measures of environmental variation as they commonly emerge as strong predictors of trait variation and are widely-explored ecological gradients [20][23][52]. Given that our five environmental predictors are necessarily correlated to some extent (Table S2), we used correlations of each environmental variable and each trait within species to identify consistent signals across species and traits. Additionally, we used multiple regression to predict intraspecific variation in each trait from the five environmental variables, for each species. The goal was to identify whether consistent combinations of environmental variables predicted intraspecific variation in each trait in each of the four species. We used linear regression models and backwards selection to remove non-significant terms from a full model using all five environmental variables.

    Results

    The amount of intraspecific variation differed widely across the six plant traits (Table S3). LDMC and wood density both varied less than two-fold and values were conserved within species, resulting in low coefficients of variation (mean CVs across species of 5.2% for LDMC and 8.6% for wood density; Table S3). Leaf thickness, leaf density and LMA varied around two-fold within species, with mean CVs across species of 14.0%, 13.7% and 16.1%, respectively. Leaf size varied widely within species with a mean coefficient of variation across the four species of 30.0% (Table S3).

    Intraspecific correlations between wood density and leaf traits

    Leaf traits were only correlated with wood density in some species, and for some traits (Table 1Fig. 2). Leaf size did not decrease with increasing wood density within any of the four species, despite this being the most consistently reported pattern of interspecific covariation between wood density and a leaf trait (Table 1Fig. 2). Similarly, there was no evidence for an intraspecific relationship between wood density and LMA. There was weak intraspecific evidence that LDMC and leaf density both increased with wood density, pointing to coordinated investment in dry matter allocation to both leaves and wood within species.
    thumbnail
    Figure 2. Nothofagus spp. wood density and leaf trait relationships in New Zealand.
    Relationships between wood density and five leaf structural traits are given for four species of Nothofagus in New Zealand. See Table 1 for correlation tests. LDMC  =  leaf dry matter content; LMA  =  leaf mass per unit area.
    thumbnail
    Table 1. Intraspecific variation in wood density and five component leaf traits for four Nothofagus species.

    Intraspecific correlations between leaf traits

    Leaf traits were generally correlated with one another within species, and these correlations were often consistent across the four Nothofagus species (Table 1). Measures of leaf structural investment (LMA, LDMC, thickness and density) were usually negatively correlated with leaf size, and positively correlated with one another except for leaf density and leaf thickness, which were negatively correlated in two of the four species.

    Environmental correlates of intraspecific trait variation

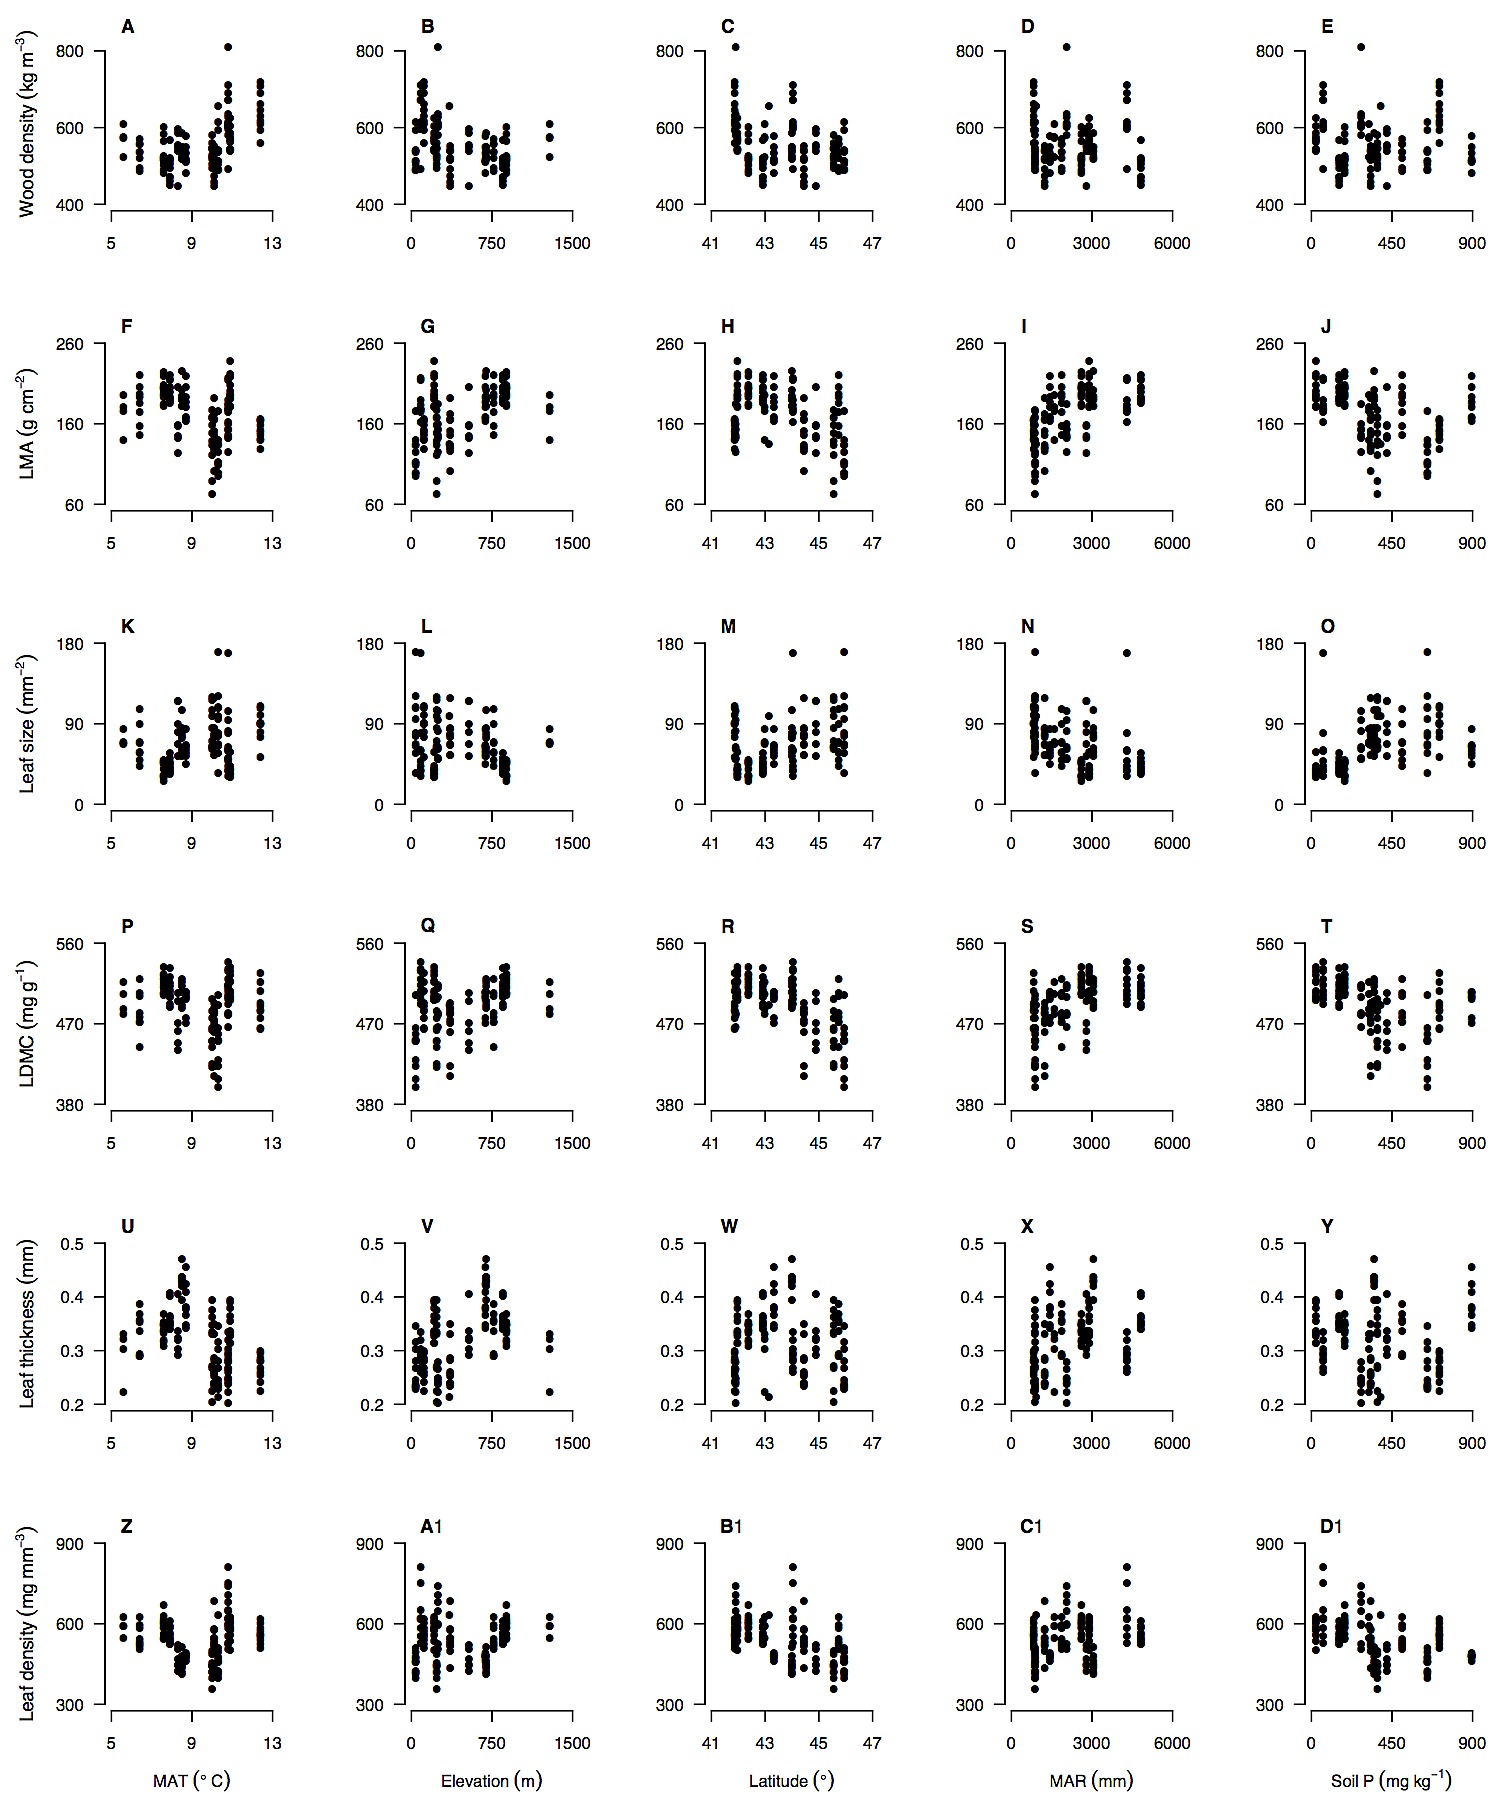
    There was some evidence for consistent trait–environment relationships across species, but the most common signal from the data was for species- and trait-specific responses to environment (Tables 2 & 3Figs. 3 & S1S2S3S4). There were no trait–environment relationships that were consistent across the four species, i.e., statistically significant and in the same direction (Table 2). There were only two trait–environment relationships that shared a consistent direction across all four species and were significant for at least two of the four species. LDMC declined with soil P and this was significant for N. solandri and N. fusca, and wood density increased with MAR and this was significant for N. menziesii and N. truncata (Table 2). There was little evidence from multiple regressions that consistent combinations of environmental variables predicted intraspecific variation in a trait in all four species (Table 3). The strongest evidence came from consistently non-significant variables. For example, in three of the four species, MAR was not retained in the final multiple regression models for wood density, LMA, LDMC or leaf density. However, the variables retained in models differed among those species for those traits (Table 3).
    thumbnail
    Figure 3. Intraspecific variation in functional traits of Nothofagus solandri along environmental gradients in New Zealand.
    Intraspecific variation in six functional traits along key environmental gradients is shown for the widespread tree species Nothofagus solandri throughout the South Island of New Zealand. Relationships are shown for each trait and the environmental variable with the highest Pearson correlation coefficient (Table 2). This species is illustrated as an example and all trait-environment relationships for all four species are shown in Figures S1S2S3S4.
    thumbnail
    Table 2. Intraspecific variation in six plant functional traits for five environmental variables in four Nothofagus species.
    thumbnail
    Table 3. Multiple regressions predicting intraspecific variation in six plant functional traits from five environmental variables in four Nothofagus species.
    We plotted the correlation coefficients in Table 2 to test whether the responses within species to environment by wood density were similar to those responses by leaf traits (Fig. 4). There was no evidence that LMA, leaf size or LDMC shared responses to environment with wood density (Fig. 4A–C). However, leaf thickness and leaf density shared responses to environment with wood density (Fig. 4D–E). Leaf thickness–environment correlations were negatively correlated with wood density–environment correlations (Fig. 4D) whereas leaf density–environment correlations were positively correlated with wood density–environment correlations (Fig. 4E). This indicates that the environmental drivers of dense wood also drive thinner, denser leaves. This is confirmed by the negative relationships between leaf thickness and leaf density (Table 1).
    thumbnail
    Figure 4. Correlation coefficients of environmental variables with wood density and leaf traits.
    Biplots show correlation coefficients between wood density and five environmental variables (x-axis), and correlation coefficients between leaf traits and environmental variables (y-axis). Each data point is a pair of correlation coefficients for a species. In each panel, the correlations between wood density and an environmental variable are plotted against the correlation coefficients for a leaf trait and the same environmental variable. There are four points representing each species, for each environmental variable. Open circles are correlations with MAR; filled circles are correlations with Latitude; open triangles are correlations with MAT; filled triangles are correlations with Elevation; open squares are correlations with soil P. Dashed line shows the 1∶1 relationship expected from interspecific trait correlations e.g., that wood density and LMA are positively correlated [37][39] and therefore so should their relationships with environment.
    We used a similar approach to evaluate whether LMA–environment correlations were shared with the component leaf traits that underpin LMA (Fig. 5). There was very strong evidence that LDMC–environment correlations and leaf density–environment correlations were both similar to LMA–environment correlations (Fig. 5A, D). This was also true for leaf thickness (Fig. 5C) but the association was weaker. Leaf size – environment correlations were weakly and negatively associated with LMA–environment correlations (Fig. 5B). The environmental conditions promoting higher LMA within species also tend towards smaller leaves, but the relationship is weak.
    thumbnail
    Figure 5. Correlation coefficients of environmental variables with leaf mass per unit area (LMA) and leaf traits.
    Biplots show correlation coefficients between LMA and five environmental variables (x-axis), and correlation coefficients between leaf traits and environmental variables (y-axis). Each data point is a pair of correlation coefficients for a species. In each panel, the correlations between LMA and an environmental variable are plotted against the correlation coefficients for a second leaf trait and the same environmental variable. There are four points representing each species, for each environmental variable. Open circles are correlations with MAR; filled circles are correlations with Latitude; open triangles are correlations with MAT; filled triangles are correlations with Elevation; open squares are correlations with soil P. Dashed line shows the 1∶1 relationship expected from interspecific traits correlations, e.g., that LMA and leaf size are negatively correlated [31] and therefore so should their relationships with environment.

    Discussion

    Intraspecific correlations between wood density and leaf traits, and among leaf traits

    Interspecific studies suggest that trait variation is coordinated among tissues, leading to the emergence of trait syndromes and economic spectra that reflect whole-plant strategies. Our data clearly demonstrate that intraspecific leaf-trait variation is strongly correlated among traits, confirming that the leaf economics spectrum applies within species. However, we found limited evidence for close coordination between leaf traits and wood density. In contrast to most interspecific trait studies [31][34][39], we found no evidence that leaf size and LMA were correlated with wood density for Nothofagus species. However, we found weak evidence that both LDMC and leaf density were positively correlated with wood density within species, a result concordant with interspecific studies [37][42] that points to shared responses of leaves and wood for dry matter allocation relative to leaf or stem volume. These findings support the hypothesis that LMA is not a surrogate for measuring the component traits underpinning it. Two of the component traits (LDMC and leaf density) correlated with wood density while the integrated trait (LMA) did not. This highlights the need to measure the components of LMA in order to determine how leaf construction covaries with other plant traits [26]. Trait-specific coupling of leaf and wood traits within species questions the general applicability of a whole-plant trait economics spectrum [3] and supports the view that leaf and stem trait variation is largely uncoupled [34].

    Why aren't leaf traits and wood density correlated within species?

    Traits may be uncoordinated within species because the constraints driving each trait operate over different parts of the same environmental gradient [16]. Alternatively it may be because of contrasting, non-linear responses by traits to environment [53]. For example, the relationship between wood density and leaf size might represent a strategy to avoid water loss, but leaf size may only decline with increasing wood density in large-leaved species exposed to seasonal water stress. The absence of a relationship between wood density and leaf size in any of the four evergreen Nothofagus species assessed here may reflect low moisture stress in New Zealand's temperate rainforests or the limited influence of moisture stress on leaf size in evergreen species having relatively small (<700 mm2) leaves (Table S3). Lastly, variation in wood density will reflect interannual variation in tree growth rate throughout the sampled core spanning many years, while traits of current-year leaves will be responding more directly to the environment in that year, to optimise resource acquisition and expenditure.

    Sources of intraspecific variation

    An unresolved question is whether intraspecific variation reflects genetic polymorphism, phenotypic plasticity, or a combination of the two. Widespread species might be inherently more variable because they are more numerous, and therefore support greater genetic polymorphism, or alternatively, because they encounter a wider diversity of environments. Common garden experiments can be used to minimise the effects of phenotypic plasticity and isolate those of genetic polymorphism. A provenance trial to examine genetic polymorphism in New Zealand Nothofagus species sampled elevational and latitudinal gradients and demonstrated substantial genetic polymorphism in seedling growth rate, leaf size and leaf shape in the two most widespread species (N. solandri and N. menziesii), and moderate polymorphism in the less widespread N. fusca [54]. In order to generalise beyond empirical studies, we need to establish whether large intraspecific variation is driven by environmental heterogeneity or simply by population size and demographic history [8]. Both of these factors should increase with geographic range size, and are not easily partitioned out. However, a controlled experiment to compare intraspecific trait variation of Australian tree species with contrasting range sizes found no evidence that widespread species had higher intraspecific variation [55]. Although it is clear that there is substantial intraspecific variation in plant functional traits among sites that differs among species, further work is needed to better understand the sources and drivers of this variation, specifically the contributions by environment and genetic variation to trait variation.

    Intraspecific trait–environment relationships

    Variation in a trait was not usually driven by the same environmental variable across all four Nothofagus species. There were only two trait–environment relationships that shared a consistent direction within each of the four species, while being statistically significant in at least two species. Results from individual species were often concordant with models of trait variation developed using interspecific relationships between the six traits and five environmental variables examined here. Interspecific studies of wood density variation and environment suggest that wood density should be greatest at high temperatures (i.e., low latitude and low elevation) [29][56][57], on relatively dry sites [58][60], and on infertile soils [61][63]. Wood density of two species (N. menziesii and N. solandri) increased with temperature (or more accurately, decreasing latitude and increasing MAT). However, wood density of N. truncata increased with latitude, contrary to expectation. Wood density of two species increased with mean annual rainfall (MAR), counter to predictions from interspecific studies. Rainfall gradients in southern New Zealand range from 668 to 4875 mm yr–1 (Table S1) with only six sites receiving less than 1000 mm yr−1. We propose that the relationship between moisture availability and wood density is strongly non-linear with both moisture-limited and excessively wet sites favouring dense wood. High rainfall is associated with two factors that limit tree growth rates and hence increase wood density. The first is nutrient leaching and reduced soil fertility. For example, in our study MAR and soil total P were negatively correlated (Table S2), providing strong support for this mechanism. The second is low solar radiation that would limit canopy photosynthesis and hence tree growth. Relatively few studies explicitly model the effect of measured soil fertility yet we demonstrate how this can determine variation in leaf structural traits such as LMA and LDMC [64], as well as wood density. Across all four species, models using indirect measures of environmental variation (elevation and latitude) were commonly stronger predictors of trait variation than direct measures (MAT and MAR, and also solar radiation (not shown)), suggesting that indirect gradients capture aspects of growing season length and photosynthetic potential that are crucial for determining trait variation in addition to the direct effects of temperature and rainfall.
    Leaf thickness declined with MAT in the two small-leaved species (N. menziesii and N. solandri) but increased with MAT in the two large-leaved species (N. fusca and N. truncata), suggesting that allocation to leaf thickness within a species is contingent on leaf size and the predominant environmental niche of a species (cool for the first pair, and warmer for the second). Intriguingly, there is no consensus on how leaf thickness varies among species at a global scale with temperature – both positive [65] and negative [66] relationships have been reported. Thick leaves clearly arise across a range of climatic situations through allocation to photosynthetically-active mesophyll cells [65], protective epidermal layers [67], or both, and these allocation patterns are not in-common across species.
    Our data provide some support to the hypothesis that suites of traits are correlated within species because of shared responses to strong environmental gradients [33][68] but see [69]. There were several instances where four of the six traits were significantly correlated with a single environmental factor within a species (e.g., elevation in N. solandri and N. menziesii). This was particularly strong for leaf traits (Fig. 5) where the environmental drivers of variation were shared between LMA and LDMC, leaf density and leaf thickness. By and large, however, the environmental drivers of variation in wood density were not shared with leaf traits (Fig. 4). The exception to this was the link between wood density, and leaf density and leaf thickness. Environments generating dense wood also selected for denser, thinner leaves, but not higher LMA, LDMC or smaller leaves. The strongest environmental drivers of high wood density, broadly speaking, were cooler and wetter climates and less fertile soils. Such conditions are known to promote thinner leaves, particularly when associated with low solar radiation [25][65]and low soil fertility, which reduces the fraction of intercellular space in leaves and hence increases leaf density [70].
    Intraspecific covariation in wood density and leaf traits among sites and with environment did not mirror results reported among species from large-scale studies encompassing larger global environmental gradients [2][56]. Large-scale studies tend to capture the ‘end-points’ of trait variation; e.g., at large latitudinal scales, large leaves and dense wood from the wet tropics are compared with needle leaves and low density softwoods from boreal conifer forests. Trait covariation with environment is an almost inevitable consequence at such large spatial scales. At smaller spatial scales, such as those in this study, trait covariation with environment may not be observed if one or either trait only responds over a portion of the environmental gradient. Optimal combinations of traits may vary along complex environmental gradients and thus traits may be somewhat decoupled within a species throughout their range. The probability of detecting relationships between multiple traits and environment will vary according to where species occur and are sampled [68]. In this study, some traits varied little within species (Table S3), while for others, the amount of intraspecific trait variation was comparable with interspecific variation at similar spatial scales, in similar environments. For example, wood density of N. solandri varied 1.8-fold from 448 kg m−3 to 811 kg m−3 (Table S3) spanning much of the range of this trait across New Zealand forests (2.9–fold from 326 kg m−3 to 930 kg m−3N = 130 species, unpublished data of the authors), and indeed globally [30]. These observations point to different mechanisms driving trait variation: for global comparisons, this is species turnover of plants having markedly different strategies or trait syndromes whereas for intraspecific variation, the mechanism is the coordinated response within a species along environmental gradients throughout its range. Our findings contribute to the growing understanding of how different mechanisms drive variation in plant functional traits at local (within community), regional (among communities within a biome) and global scales. Lastly, our study was confined to four closely-related tree species over spatial scales of <1000 km. Our data may not be representative of the amount of intraspecific variation typical of all species, across different plant growth forms, and at contrasting locations along global environmental gradients. Further studies of widely distributed species, particularly those spanning biomes will provide a valuable contrast with our data [19].

    Supporting Information

    Figures_S1.tif
    Intraspecific variation in six functional traits along five environmental gradients for Nothofagus solandri.

    Figures S1. 

    Intraspecific variation in six functional traits along five environmental gradients for Nothofagus solandri .
    doi:10.1371/journal.pone.0058878.s001
    (TIFF)

    Figures S2. 

    Intraspecific variation in six functional traits along five environmental gradients for Nothofagus menziesii .
    doi:10.1371/journal.pone.0058878.s002
    (TIFF)

    Figures S3. 

    Intraspecific variation in six functional traits along five environmental gradients Nothofagus fusca .
    doi:10.1371/journal.pone.0058878.s003
    (TIFF)

    Figures S4. 

    Intraspecific variation in six functional traits along five environmental gradients for Nothofagus truncata .
    doi:10.1371/journal.pone.0058878.s004
    (TIFF)

    Table S1. 

    Thirty sites in southern New Zealand sampled for Nothofagus wood density and leaf structural traits.
    doi:10.1371/journal.pone.0058878.s005
    (DOCX)

    Table S2. 

    Pearson's correlation coefficients between environmental variables used to predict trait variation.
    doi:10.1371/journal.pone.0058878.s006
    (DOCX)

    Table S3. 

    Inter/intraspecific variation in Nothofagus wood density and leaf traits sampled throughout southern New Zealand.
    doi:10.1371/journal.pone.0058878.s007
    (DOCX)

    Table S4. 

    Wood density and leaf trait data sampled in Nothofagus throughout southern New Zealand.
    doi:10.1371/journal.pone.0058878.s008
    (DOCX)

    Acknowledgments

    We thank the Department of Conservation and the Todhunter and Stevenson families for permission to sample forests they administer or own; Jessica Thorn and Jeanne Portier for assistance; Susan Walker, Geoff Walls and Bill Lee for suggesting sampling sites; Anne Sutherland and Jake Overton for providing Figure 1; and Alvaro Promis, Ian Dickie, Matt McGlone, Norman Mason and two anonymous reviewers for constructive review.

    Author Contributions

    Conceived and designed the experiments: SJR RBA RDS DAP. Performed the experiments: SJR RPB TAE JMH CWM. Analyzed the data: SJR DAP. Wrote the paper: SJR DAP.

    References

    1. 1.Webb LJ (1959) A physiognomic classification of Australian rain forests. Journal of Ecology 47: 551–580. 
    2. 2.Wright IJ, Reich PB, Westoby M, Ackerly DD, Baruch Z, et al. (2004) The worldwide leaf economics spectrum. Nature 428: 821–827. 
    3. 3.Freschet GT, Cornelissen JHC, van Logtestijn RSP, Aerts R (2010) Evidence of the 'plant economics spectrum' in a subarctic flora. Journal of Ecology 98: 362–373. 
    4. 4.Niinemets U (1999) Components of leaf dry mass per area - thickness and density - alter leaf photosynthetic capacity in reverse directions in woody plants. New Phytologist 144: 35–47. 
    5. 5.Wilson PJ, Thompson K, Hodgson JG (1999) Specific leaf area and leaf dry matter content as alternative predictors of plant strategies. New Phytologist 143: 155–162. 
    6. 6.Wright IJ, Reich PB, Cornelissen JHC, Falster DS, Groom PK, et al. (2005) Modulation of leaf economic traits and trait relationships by climate. Global Ecology and Biogeography 14: 411–421. 
    7. 7.Ackerly DD, Cornwell WK (2007) A trait-based approach to community assembly: partitioning of species trait values into within- and among-community components. Ecology Letters 10: 135–145. 
    8. 8.Albert CH, Grassein F, Schurr FM, Vieilledent G, Violle C (2011) When and how should intraspecific variability be considered in trait-based plant ecology? Perspectives in Plant Ecology Evolution and Systematics 13: 217–225. 
    9. 9.Albert CH, Thuiller W, Yoccoz NG, Douzet R, Aubert S, et al. (2010) A multi-trait approach reveals the structure and the relative importance of intra- vs. interspecific variability in plant traits. Functional Ecology 24: 1192–1201. 
    10. 10.Albert CH, Thuiller W, Yoccoz NG, Soudant A, Boucher F, et al. (2010) Intraspecific functional variability: extent, structure and sources of variation. Journal of Ecology 98: 604–613. 
    11. 11.Hulshof CM, Swenson NG (2010) Variation in leaf functional trait values within and across individuals and species: an example from a Costa Rican dry forest. Functional Ecology 24: 217–223. 
    12. 12.Kembel SW, Cahill JF (2011) Independent Evolution of Leaf and Root Traits within and among Temperate Grassland Plant Communities. PLoS ONE 6. 
    13. 13.Silvertown J, Dodd M (1996) Comparing plants and connecting traits. Philosophical Transactions of the Royal Society of London Series B-Biological Sciences 351: 1233–1239. 
    14. 14.Ackerly DD (2002) Comparative plant ecology and the role of phylogenetic information. Physiological Plant Ecology: the 39th Symposium of the British Ecological Society (eds MC Press & JD Scholes) 391–413. 
    15. 15.Holdaway RJ, Richardson SJ, Dickie IA, Peltzer DA, Coomes DA (2011) Species- and community-level patterns in fine root traits along a 120 000-year soil chronosequence in temperate rain forest. Journal of Ecology 99: 954–963. 
    16. 16.Lusk CH, Reich PB, Montgomery RA, Ackerly DD, Cavender-Bares J (2008) Why are evergreen leaves so contrary about shade? Trends in Ecology & Evolution 23: 299–303. 
    17. 17.Sugiyama S (2003) Geographical distribution and phenotypic differentiation in populations of Dactylis glomerata L. in Japan. Plant Ecology 169: 295–305. 
    18. 18.Richardson SJ, Peltzer DA, Allen RB, McGlone MS (2005) Resorption proficiency along a chronosequence: Responses among communities and within species. Ecology 86: 20–25. 
    19. 19.Martinez-Vilalta J, Cochard H, Mencuccini M, Sterck F, Herrero A, et al. (2009) Hydraulic adjustment of Scots pine across Europe. New Phytologist 184: 353–364. 
    20. 20.Hovenden MJ, Vander Schoor JK (2006) The response of leaf morphology to irradiance depends on altitude of origin in Nothofagus cunninghamii. New Phytologist 169: 291–297. 
    21. 21.Fajardo A, Piper FI (2011) Intraspecific trait variation and covariation in a widespread tree species (Nothofagus pumilio) in southern Chile. New Phytologist 189: 259–271. 
    22. 22.Garnier E, Shipley B, Roumet C, Laurent G (2001) A standardized protocol for the determination of specific leaf area and leaf dry matter content. Functional Ecology 15: 688–695. 
    23. 23.Poorter H, Niinemets U, Poorter L, Wright IJ, Villar R (2009) Causes and consequences of variation in leaf mass per area (LMA): a meta-analysis. New Phytologist 182: 565–588. 
    24. 24.Craine JM, Towne EG (2010) High leaf tissue density grassland species consistently more abundant across topographic and disturbance contrasts in a North American tallgrass prairie. Plant and Soil 337: 193–203. 
    25. 25.Witkowski ETF, Lamont BB (1991) Leaf specific mass confounds leaf density and thickness. Oecologia 88: 486–493. 
    26. 26.Hodgson JG, Montserrat-Marti G, Charles M, Jones G, Wilson P, et al. (2011) Is leaf dry matter content a better predictor of soil fertility than specific leaf area? Annals of Botany 108: 1337–1345. 
    27. 27.Craine JM, Lee WG (2003) Covariation in leaf and root traits for native and non-native grasses along an altitudinal gradient in New Zealand. Oecologia 134: 471–478. 
    28. 28.Santiago LS, Goldstein G, Meinzer FC, Fisher JB, Machado K, et al. (2004) Leaf photosynthetic traits scale with hydraulic conductivity and wood density in Panamanian forest canopy trees. Oecologia 140: 543–550. 
    29. 29.Chave J, Coomes D, Jansen S, Lewis SL, Swenson NG, et al. (2009) Towards a worldwide wood economics spectrum. Ecology Letters 12: 351–366. 
    30. 30.Zanne AE, Westoby M, Falster DS, Ackerly DD, Loarie SR, et al. (2010) Angiosperm wood structure: global patterns in vessel anatomy and their relation to wood density and potential conductivity. American Journal of Botany 97: 207–215. 
    31. 31.Pickup M, Westoby M, Basden A (2005) Dry mass costs of deploying leaf area in relation to leaf size. Functional Ecology 19: 88–97. 
    32. 32.Kooyman RM, Westoby M (2009) Costs of height gain in rainforest saplings: main-stem scaling, functional traits and strategy variation across 75 species. Annals of Botany 104: 987–993. 
    33. 33.Malhado ACM, Malhi Y, Whittaker RJ, Ladle RJ, ter Steege H, et al. (2009) Spatial trends in leaf size of Amazonian rainforest trees. Biogeosciences 6: 1563–1576. 
    34. 34.Baraloto C, Paine CET, Poorter L, Beauchene J, Bonal D, et al. (2010) Decoupled leaf and stem economics in rain forest trees. Ecology Letters 13: 1338–1347. 
    35. 35.Wright IJ, Falster DS, Pickup M, Westoby M (2006) Cross-species patterns in the coordination between leaf and stem traits, and their implications for plant hydraulics. Physiologia Plantarum 127: 445–456. 
    36. 36.Wright IJ, Ackerly DD, Bongers F, Harms KE, Ibarra-Manriquez G, et al. (2007) Relationships among ecologically important dimensions of plant trait variation in seven Neotropical forests. Annals of Botany 99: 1003–1015. 
    37. 37.Kitajima K, Poorter L (2010) Tissue-level leaf toughness, but not lamina thickness, predicts sapling leaf lifespan and shade tolerance of tropical tree species. New Phytologist 186: 708–721. 
    38. 38.Bucci SJ, Goldstein G, Meinzer FC, Scholz FG, Franco AC, et al. (2004) Functional convergence in hydraulic architecture and water relations of tropical savanna trees: from leaf to whole plant. Tree Physiology 24: 891–899. 
    39. 39.Ishida A, Nakano T, Yazaki K, Matsuki S, Koike N, et al. (2008) Coordination between leaf and stem traits related to leaf carbon gain and hydraulics across 32 drought-tolerant angiosperms. Oecologia 156: 193–202. 
    40. 40.Baltzer JL, Gregoire DM, Bunyavejchewin S, Noor NSM, Davies SJ (2009) Coordination of foliar and wood anatomical traits contributes to tropical tree distribution and productivity along the Malay-Thai peninsula. American Journal of Botany 96: 2214–2223. 
    41. 41.Zhang JL, Cao KF (2009) Stem hydraulics mediates leaf water status, carbon gain, nutrient use efficiencies and plant growth rates across dipterocarp species. Functional Ecology 23: 658–667. 
    42. 42.Markesteijn L, Poorter L, Paz H, Sack L, Bongers F (2011) Ecological differentiation in xylem cavitation resistance is associated with stem and leaf structural traits. Plant Cell and Environment 34: 137–148. 
    43. 43.Poole AL (1958) Studies of New Zealand Nothofagus species. III The entire-leaved species. Transactions of the Royal Society of New Zealand 85: 551–564. 
    44. 44.Wiser SK, Hurst JM, Wright EF, Allen RB (2011) New Zealand's forest and shrubland communities: a quantitative classification based on a nationally representative plot network. Applied Vegetation Science 14: 506–523. 
    45. 45.Wardle JA (1984) The New Zealand beeches: ecology, utilisation and management. Christchurch, New Zealand: New Zealand Forest Service. 
    46. 46.Leathwick JR (1998) Are New Zealand's Nothofagus species in equilibrium with their environment? Journal of Vegetation Science 9: 719–732. 
    47. 47.Cornelissen JHC, Lavorel S, Garnier E, Diaz S, Buchmann N, et al. (2003) A handbook of protocols for standardised and easy measurement of plant functional traits worldwide. Australian Journal of Botany 51: 335–380. 
    48. 48.Leathwick JR, Overton JM, McLeod M (2003) An environmental domain classification of New Zealand and its use as a tool for biodiversity management. Conservation Biology 17: 1612–1623. 
    49. 49.Richardson SJ, Allen RB, Doherty JE (2008) Shifts in leaf N : P ratio during resorption reflect soil P in temperate rainforest. Functional Ecology 22: 738–745. 
    50. 50.Richardson SJ, Peltzer DA, Allen RB, McGlone MS (2010) Declining soil fertility does not increase leaf lifespan within species: evidence from the Franz Josef chronosequence, New Zealand. New Zealand Journal of Ecology 34: 306–310. 
    51. 51.Palow DT, Nolting K, Kitajima K (2012) Functional trait divergence of juveniles and adults of nine Inga species with contrasting soil preference in a tropical rain forest. Functional Ecology 26: 1144–1152. 
    52. 52.Sundqvist MK, Giesler R, Wardle DA (2011) Within- and Across-Species Responses of Plant Traits and Litter Decomposition to Elevation across Contrasting Vegetation Types in Subarctic Tundra. PLoS ONE 6. 
    53. 53.Magnani F (2009) Phenotypic variability: underlying mechanisms and limits do matter. New Phytologist 184: 277–279. 
    54. 54.Wilcox MD, Ledgard NJ (1983) Provenance variation in the New Zealand species of Nothofagus. New Zealand Journal of Ecology 6: 19–31. 
    55. 55.Pohlman CL, Nicotra AB, Murray BR (2005) Geographic range size, seedling ecophysiology and phenotypic plasticity in Australian Acacia species. Journal of Biogeography 32: 341–351. 
    56. 56.Swenson NG, Enquist BJ (2007) Ecological and evolutionary determinants of a key plant functional trait: Wood density and its community-wide variation across latitude and elevation. American Journal of Botany 94: 451–459. 
    57. 57.Wiemann MC, Williamson GB (2002) Geographic variation in wood specific gravity: Effects of latitude, temperature, and precipitation. Wood and Fiber Science 34: 96–107. 
    58. 58.Martinez-Cabrera HI, Jones CS, Espino S, Schenk HJ (2009) Wood anatomy and wood density in shrubs: responses to varying aridity along transcontinental transects. American Journal of Botany 96: 1388–1398. 
    59. 59.Barajas-Morales JL (1985) Wood structural differences between trees of two tropical forests. IAWA Bulletin 6: 355–364. 
    60. 60.Barajas-Morales JL (1987) Wood specific gravity in species from two tropical forests in Mexico. IAWA Bulletin 8: 143–148. 
    61. 61.Muller-Landau HC (2004) Interspecific and inter-site variation in wood specific gravity of tropical trees. Biotropica 36: 20–32. 
    62. 62.Baker TR, Phillips OL, Malhi Y, Almeida S, Arroyo L, et al. (2004) Variation in wood density determines spatial patterns in Amazonian forest biomass. Global Change Biology 10: 545–562. 
    63. 63.ter Steege H, Pitman NCA, Phillips OL, Chave J, Sabatier D, et al. (2006) Continental-scale patterns of canopy tree composition and function across Amazonia. Nature 443: 444–447. 
    64. 64.Mason NWH, Richardson SJ, Peltzer DA, Wardle DA, De Bello F, et al. (2012) Changes in co-existence mechanisms along a long-term soil chronosequence revealed by functional trait diversity. Journal of Ecology 100: 678–689. 
    65. 65.Niinemets U (2001) Global-scale climatic controls of leaf dry mass per area, density, and thickness in trees and shrubs. Ecology 82: 453–469. 
    66. 66.Onoda Y, Westoby M, Adler PB, Choong AMF, Clissold FJ, et al. (2011) Global patterns of leaf mechanical properties. Ecology Letters 14: 301–312. 
    67. 67.Castro-Diez P, Puyravaud JP, Cornelissen JHC (2000) Leaf structure and anatomy as related to leaf mass per area variation in seedlings of a wide range of woody plant species and types. Oecologia 124: 476–486. 
    68. 68.Cunningham SA, Summerhayes B, Westoby M (1999) Evolutionary divergences in leaf structure and chemistry, comparing rainfall and soil nutrient gradients. Ecological Monographs 69: 569–588. 
    69. 69.De Frenne P, Graae BJ, Kolb A, Shevtsova A, Baeten L, et al. (2011) An intraspecific application of the leaf-height-seed ecology strategy scheme to forest herbs along a latitudinal gradient. Ecography 34: 132–140. 
    70. 70.Niinemets U, Portsmuth A, Truus L (2002) Leaf structural and photosynthetic characteristics, and biomass allocation to foliage in relation to foliar nitrogen content and tree size in three Betula species. Annals of Botany 89: 191–204. 
    71. 71.Leathwick JR (2001) New Zealand's potential forest pattern as predicted from current species-environment relationships. New Zealand Journal of Botany 39: 447–464. 

    For further details log on website :
    http://journals.plos.org/plosone/article?id=10.1371/journal.pone.0058878

    Advantages and Disadvantages of Fasting for Runners

    Author BY   ANDREA CESPEDES  Food is fuel, especially for serious runners who need a lot of energy. It may seem counterintuiti...