Blog List

Friday, 9 December 2016

Air Pollution Taking a Steep Toll on Kathmandu Residents

Author
BY SLOK GYAWALI – NOVEMBER 28, 2016

Government has been slow to take action in one of the world's most polluted cities, say advocates

Nepal’s image as an unadulterated tourist destination — with its pristine mountains, snow covered peaks, and bright blue skies — is in jeopardy. Life in the country’s capital city doesn’t align with this immaculate representation. For years, Kathmandu’s rapidly growing population has struggled with increasing air pollution and the associated impacts on health.

At the same time, the government has struggled to monitor air quality in the city. In 2007, the last air monitoring station in Kathmandu broke due to lack of proper maintenance, effectively ending the city’s monitoring program. The program wasn’t replaced until August of this year, when Nepal’s Department of Environment installed three new air monitoring stations across the city.
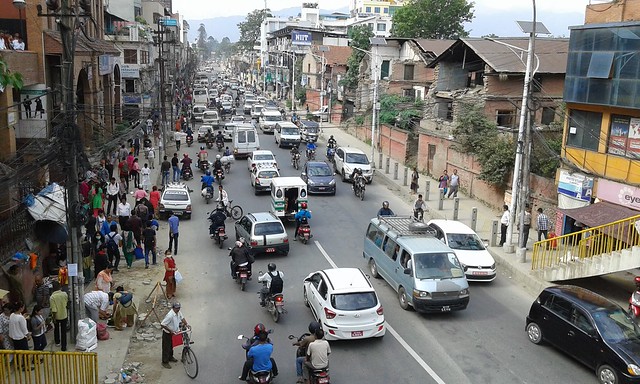
photo of Kathmandu traffic

Photo by Slok Gyawali
Increasing traffic is a primary contributor to poor air quality in Kathmandu.

The results from the new monitoring stations were disappointing but not surprising. Measures of both PM2.5 and PM 10 were significantly higher than standards set by the national government, recording PM 10 levels as high as 188 micrograms per cubic meter (µg/m3) and PM 2.5 as high as 125 µg/m3 in central Kathmandu. Nepal’s National Ambient Air Quality Standards set limits at 120µg/m3 for PM 10 and 40µg/m3 for PM 2.5.

These results are concerning, but findings from other surveys are even worse. For example, in 2014, The Kathmandu Post reported data from the 2014 Yale Environmental Performance Index, which indicated PM 2.5 levels in Kathmandu measured above 500 micrograms per cubic meter, 20 times higher than the World Health Organization’s guidelines. Another report published in 2014 by Clean Energy Nepal showed that in certain areas of Kathmandu, PM10 level reached 781 μg/m3 and PM2.5 levels spiked to 260 μg/m3, well above the recently collected state data.

The numbers vary in accordance with when and where the data is collected. According to Clean Energy Nepal, given Kathmandu valley’s bowl shaped topography, pollution is worse in the winter due to thermal inversion: a layer of warm air acts a lid that traps cold air and pollutants closer to the ground. During the monsoon and autumn seasons — when the recent government data was collected — pollutants can escape more freely, which improves air quality in the city. 

Air quality in Nepal doesn’t stack up well against that in other countries. Yale’s 2016 Environmental Performance Index, which ranks countries from best to worst based on various environmental metrics, ranks Nepal 177 out of 180 countries for air quality. Public perception of Kathmandu’s pollution is in line with the Yale ranking: In a perception survey of tourists published by Serbia-based research website Numbeo.com in 2015, Nepal’s capital city was ranked the third most polluted city in the world.
While the poor air quality has raised the ire of Kathmandu’s denizens, the city government has been slow to take action. Some officials question the validity of the available data. “I have been trying to find the correct data that back all these studies and so far I haven’t been able to find any,” Ganesh Kumar Shrestha, director-general of the Department of Environment, told Earth Island Journal when asked about the non-government research. “The research from Serbia was a perception survey, which has no scientific value, while the Yale survey is very narrow to show much.”
With regards to the recent government data, Shrestha acknowledged that pollution was high, but said there was “no need to worry” because the numbers do not remain constant, adding that there is a need for “further analysis to measure actual air pollution levels.” 
To those studying the effects of air pollution in Kathmandu, the public health impacts are unambiguous. Fine particles are known to cause inflammation and contribute to lung cancer, cardiovascular disease, birth defects, and premature death. A recent study found “extremely high concentration” of 15 priority polycyclic aromatic hydrocarbons (PAHs) — a group of highly carcinogenic organic compounds that are formed due to the incomplete combustion of fuels including coal, wood, petroleum products, and garbage — in ambient particles collected in the Kathmandu valley from April 2013 through March 2014. And in a 2009 report, the Nepal Health Research Council and WHO estimated that 1,926 premature deaths in Kathmandu can be linked to air pollution every year.
In Kathmandu, these health impacts are observably worse for traffic police officers, who have to spend a minimum of 14 hours a day on the roads guiding more than 700,000 vehicles through intersections. Currently, not a single traffic light in the city is functional, a problem that has persisted for more than a year. A 2015 study to assess pulmonary functions in the traffic police personnel working in Kathmandu valley found the longer they performed traffic duty, the greater the harm to their lungs. A source within the Nepal Police Hospital says that police working the traffic beat often suffer higher rates of eye problem, hearing loss, and irritability without any additional medical or leave provisions.
Deputy Inspector General of Police Prakash Aryal is concerned about the situation: “My people have to work under extreme circumstances, every time I ask them to go do their duty, I am in a dilemma. As a manager I have a responsibility to ask them to do their job well, but I feel I am exploiting these people knowing the risk to their health.”
Indeed, a 2012 report by ICIMOD states that the problem is exacerbated by the fact that more than a third of vehicles fail to comply with Nepal’s emission standards. Aryal believes more than 80 percent of vehicles are non-compliant, but traffic police are not able to enforce emissions standards.
Air pollution in Nepal is strongly linked to the city’s growing population — Kathmandu has one of the highest rates of urbanization in the world. Unfortunately, it also lacks an efficient public transport system. As a result, many residents have chosen to buy private vehicles. Registered vehicles in the capital rose from fewer than 200,000 in 2001/2002 to more than 700,000 in 2012/2013, and by some estimates 60 percent of the city’s air pollution can be attributed to vehicle emissions.

Given the dangerous situation, environmental activists started the MaskMandu campaign in June 2016, declaring Kathmandu a “Mask-Must Zone.” Shail Shrestha, president of Cycle City Network Nepal, a group the promotes cycling as a means to reduce carbon emissions, says this isn’t a one-off event and that the coalition of activists involved with the campaign will maintain pressure on the local government until air pollution reduces enough to meet the National Air Quality Standards.
The work won’t be easy. Rajan Thapa, program coordinator for Clean Air Nepal, which also helped organize MaskMandu, says, “Over the years we have approached various ministers and departments but the response has not been good. We need to see some action.” He says the problem is not that Nepal does not have laws — the right to a clean environment is enshrined in the national constitution — the problems are implementation and a clear understanding of whose responsibility it is to enforce emissions standards.
There is acknowledgment, even amongst some in the government, that air pollution is making Kathmandu unlivable. But so far, acknowledgment hasn’t translated into government action. The city’s new air quality monitoring program is a step in the right direction — now it’s time for the state to step up and address this pressing environmental health crisis. 

For further information log on website :
http://www.earthisland.org/journal/index.php/elist/eListRead/air_pollution_taking_toll_on_kathmandu_residents

At the Sharp End

Author

South Africa’s private game reserves, which have played an important role in rhino conservation, are now finding their charges a liability. 

BY PHOTOS AND STORY BY ANN & STEVE TOON

photo of a rhinoceros

All photos by Ann and Steve Toon

While anti-poaching efforts have had some limited success in Kruger National Park farther north, it seems to have simply shifted the problem elsewhere, to places like KwaZulu-Natal , which is fast becoming ground zero of South Africa›s rhino poaching crisis.

Simon Naylor has just finished dehorning a rhino. It’s a white rhino bull, a two-ton behemoth incongruously sporting a cerise blindfold and matching earplugs, accessories that help ensure the tranquilized animal stays calm. Here on Phinda, a private game reserve in South Africa’s KwaZulu-Natal (KZN) province, which Naylor manages, rhinos tolerate the daily traffic of safari-viewing vehicles and the excited chatter of their top-dollar guests. But a groggy, disoriented rhino bull having its horns sawn off is unlikely to be so relaxed. Naylor’s team works quickly, eager to finish the job and see the rhino get back on its feet. It’s a well-practiced routine: They’ve carried out this procedure on dozens of rhinos.

Phinda’s wildlife has been having a hard time. The reserve’s 23,000 hectares are a rich tapestry of habitats, including savannah, thorn bush, acacia woodland, marsh, and a rare sand forest. But two years of severe drought in Southern Africa have left the landscape looking more like a desert. It’s great for game viewing; the barren vegetation makes for good visibility and few places for animals to hide. But it’s tough on the wildlife struggling to find anything to eat. 

Phinda’s rhinos face yet another threat to their survival, and it’s the reason Naylor has been busy doing a job he doesn’t enjoy. Rhinos should have horns, he believes. But dehorning has become a necessary evil in Phinda, as on so many other private reserves in Zululand. With rhino poaching rampant in South Africa, conservationists and rhino owners are being forced to take drastic measures to minimize the risk to their charges.

It’s taken Naylor and his team two weeks to dehorn a large proportion of Phinda’s rhinos, and that’s only the beginning of the process. “It was a big task and now we will have to monitor all these rhinos carefully to see how they’re getting on,” he explains. “We want to ensure there is no negative [impact on] their well-being and social behavior. And we want to gauge whether this drastic action has in fact deterred poachers from planning or entering the park.”
South Africa’s government, often criticized for its response to the poaching crisis, has suggested that increased security in the country’s state-run parks has started to show encouraging results. The first eight months of 2016 saw 702 rhinos poached in South Africa, compared with 796 in the first seven months of 2015. In Kruger National Park, the epicenter of poaching activities, the number of rhino carcasses found was 458, against 557 in the same period last year. Edna Molewa, the country’s environment minister, says she hopes 2016 will be the year in which the poaching tide is turned. “We are under no illusions of the challenges ahead, but we are confident that slowly but surely, progress is being made. We are not claiming victory, but we are claiming success that accounts for the downward trend,” she said earlier this year.
Naylor is far less optimistic. He thinks the poaching situation is getting worse. “I have seen no evidence demand for rhino horn is reducing and, from the information we’re getting, the price of horn per kilo on the black market is growing every day,” he says. 
Rhino horn, used variously as a traditional medicine, a high status gift, and an investment, is sold on the black market for up to $65,000 per kilo. The current surge in rhino poaching, primarily driven by demand for horn in Vietnam and China, has had a devastating impact on Africa’s rhinos. Just 150 years ago, more than a million black and white rhinos roamed the continent’s savannahs. Today their numbers have dropped to fewer than 27,000. Most of Africa’s remaining rhinos are found in just four countries – South Africa, Namibia, Zimbabwe, and Kenya – and very few of these ancient animals now survive outside of protected areas and sanctuaries.
photo of a wildebeest under a sunrise or sunset Private game reserves – which typically offer safaris to tourists – have played a very important role in rhino conservation over the past few decades.
According to official figures, the number of rhinos killed annually in South Africa, which is home to around 75 percent of the continent’s rhino population, has increased by a dismaying 9,000 percentsince 2007 – from 13 animals poached that year to a record 1,215 in 2014. Last year’s figure was 1,175, but many conservationists believe the true number is significantly higher, as many carcasses are never found, and some private rhino owners do not report poaching incidents.
The situation in KwaZulu-Natal – the spiritual home of the rhino, where the southern race of the white rhino was saved from extinction – is particularly bad. While anti-poaching efforts have had some limited success in Kruger National Park farther north, it seems to have simply shifted the problem elsewhere, to places like KZN, which is fast becoming ground zero of South Africa’s rhino poaching crisis.
In comparison to Kruger’s 2 million hectares, KZN’s largest reserve, Hluhluwe-iMfolozi, is a mere 96,000 hectares, but it contains the highest density of wild white rhinos anywhere in the world. Criminal syndicates are increasingly sending their armed poachers to reserves such as Hluhluwe-iMfolozi, where anti-poaching measures are less intensive. Incursions now happen almost daily. 
“The situation in KZN is dire in that we are losing rhinos, both black and white, at an alarming rate,” says Dr. Jacques Flamand, project leader of the Black Rhino Range Expansion Project, which has been instrumental in establishing new black rhino habitats on private game reserves by translocating rhinos from reserves with healthy populations. Flamand says poaching threatens the future success of this endeavor.
“So far we have lost 128 rhinos this year in KZN, compared to 93 by this time last year. Some 122 of these were [in] state parks and six were on private land, 117 were white rhino and 11 were black. This translates to 3.7 percent of the white rhino population being poached and 2.2 percent of the black rhino population,” Flamand says. “Such a proportion is unsustainable in the long term, particularly for our black rhino population, whose 5-year mean annual growth rate in KZN was 2.48 percent. As most of the black rhinos we source are [translocated] from Hluhluwe-iMfolozi, this will impact … the number of animals we will be able to draw on for our future populations, so it will have the effect of slowing down our population growth further.”
infographicsource: WWF Global
Phinda’s Simon Naylor says close to 15 populations of rhino on both private and state land have already gone extinct in KZN, due mainly to the pressures of poaching. Besides the populations lost to poachers, the cost of paying for the rhinos’ security was simply too much for landowners so they sold their animals to other reserves. But the number of reserves wanting to buy rhinos, too, is decreasing. Positive growth trends changed in 2012 and for the first time in decades the population in the province of KZN is in decline, at a rate of 4.1 percent per annum. There are now more deaths due to poaching than births.
Naylor says dehorning Phinda’s rhinos became unavoidable as the poaching crisis worsened: “Close to 100 rhinos have been shot and killed within a 50 kilometer radius of Phinda in the last 12 months. Dehorning changes the risk/reward ratio substantively against the poacher. It increases the time poachers will have to spend in the park looking for rhino with horn – increasing the opportunity for our field rangers to arrest them,” he explains. “Of course, the horn is the essence of a rhino, but all of us would rather see a live, hornless rhino than a dead and bloated hornless carcass.” 

Dehorning Dilemma 

What characterizes a rhino? Some might say its huge size, immense power, thick legs, or prehistoric appearance. But, for most, surely it is their horn. In recent years dehorning has become more commonplace as the threat from poaching continues to rise. Dehorning doesn’t hurt the animal – it’s like cutting fingernails or trimming horses’ hooves. But, as with any surgical procedure, it is not without its risks, and – as with any proposed solution to a very complex problem – dehorning will never be a panacea for poaching. 
Evidence shows that dehorning has a place as part of a suite of measures to protect rhinos from poachers but, when conducted in isolation, can have unintended consequences. 
Dehorning isn’t a magic bullet: Poachers will still kill dehorned animals for the stump of horn that remains, or to avoid wasting time tracking the same animal on another night, and the dehorning process itself carries risk (see “Dehorning Dilemma”). At best, it may simply persuade poachers to try elsewhere. As Jacques Flamand points out: “Almost all of the private Zululand game reserves that surround the state reserves have dehorned their rhinos. The only attractive rhinos available in the province are the ones in places like Hluhluwe-iMfolozi, which is understaffed by security personnel due to severe budget cuts by the provincial government, which does not see poaching as a priority crime.”
State parks will never be able to afford to dehorn every rhino, so their territories will be much more rewarding for poachers, says Cathy Dean, director of Save the Rhino, an international rhino conservation group. She says state rangers need to have access to high-end technology as well as advance intelligence if they are to beat the poachers at their game. Funding is flowing to Hluhluwe-iMfolozi for more advanced technology. That helps, but isn’t enough. “We need the basics done well: the right training, and good-quality equipment. We also need rangers to be led from the front, with people working at the top with tangible field experience,” she says.
Dean says working on advance intelligence gathering is critical because the information can help rangers nab poachers before they kill an animal. This process requires building informer networks and good relationships with communities so that they come forward with information, which increases the capacity of enforcement agencies to follow the money, she says. Getting the kingpins rather than lower-level poachers can turn the tide in conservationists’ favor.
Private rhino reserves – which typically offer safaris to tourists – have played a very important role in rhino conservation over the past few decades. Rhinos are one of the “Big Five” must-see tourist drawcards (along with lions, leopards, elephants, and Cape buffalo), so as South Africa’s rhino population recovered from the 1960s onwards, game reserves were keen to reintroduce the animals. Reserves such as Hluhluwe-iMfolozi, which had as many rhinos as they could hold, began selling their surplus animals, and a lucrative trade in wild rhinos developed, with individual animals selling for as much as $80,000. This raised money for conservation, and ensured new rhino populations were established. By 2015, 33 percent of South Africa’s white rhino population was to be found within 2 million hectares of privately owned game reserves. 

The Legalization Conundrum

Controversial proposals to legalize international trade in rhino horn have divided opinion among conservationists and rhino managers. Rhino horn, which is essentially keratin, grows like fingernails, so it can be harvested sustainably, unlike elephant ivory. Advocates of a regulated trade system argue that flooding the market with legally stockpiled rhino horn would drive down the price, and decrease the incentive for poachers. Income from horn sales would help reserve owners fund the high cost of anti-poaching measures, and redress the imbalance between the well-funded criminal syndicates behind poaching and the financially stretched conservation bodies attempting to safeguard rhinos.
Opponents, including several international conservation groups, argue that legal sales would create a smokescreen for continued black market trading, as it would be extremely difficult to distinguish legal and illegal horn. They believe that key consumer states like China and Vietnam lack the capacity or political will to police trade effectively, and that widespread corruption in rhino range states and end-user countries would make strict monitoring impossible. Increased supply could also lead to greater demand for rhino horn, while legalizing horn trade would undermine efforts to educate consumers that horn is of negligible medicinal benefit.
With around 20 tons of rhino horns stockpiled by the South African government, and at least two tons in private hands, there is likely to be continuing pressure to legalize trade or allow at least a one-off sale. But a proposal to legalize trade put forward by Swaziland was rejected at the recent Convention on International Trade in Endangered Species of Wild Fauna and Flora (CITES), held in Johannesburg earlier this year, so for now, at least, the issue has been put to bed.
Stepping up anti-poaching measures has put considerable financial pressure on both state and private rhino owners in South Africa. According to the Private Rhino Owners Association, poaching has cost private reserves more than $78 million in the past eight years, due to a combination of additional security costs of more than $50 million, and the loss of animals worth $28 million. Nationally, rhinos killed illegally in 2015 represented an estimated loss of around $25 million based on average live rhino sale values.
Private rhino reserves, which are mostly self-funded operations, are finding it prohibitively expensive to protect rhinos effectively, especially since their live value is dropping as demand for animals decreases. They are becoming more of a liability than an asset. Since the start of the poaching crisis eight years ago, more than 70 private reserves in South Africa have divested their rhino populations – a sad statistic, as prior to this the number of private rhino reserves introducing new rhinos into the wild was growing.
Dehorning is now yet another task on the increasingly long list of work private reserves like Phinda have to carry out in order to keep their animals safe. “Rhino security takes up a huge proportion of our time, effort, and budget,” says Naylor. “Total reserve security costs in the 2015-16 financial year was about 8 million rand (US $575,000) for the year.” Security work includes checking the entire fenceline daily, deploying field rangers, monitoring access into the park each day, and occasionally using aerial patrols. Then there’s the constant training of field staff who have to be on standby 24/7 to react to incursions or suspicious activity inside or outside the park. 
“Dehorning will not replace [other security measures] or allow for security reduction,” Naylor adds. “To be effective it must be in conjunction with high levels of security. We could have easily just sold off or given away a large percentage of our [rhino] population due to the threat and pressure. But our population is of massive conservation value to the province, country, and world. We do not want to capitulate as so many have already.”
To date, Phinda has lost seven rhinos to poaching. “It’s a low number compared to the size of the population and surrounding area, and that’s mainly due to the many proactive measures we’ve implemented,” Naylor says.
Much of the security bill at Phinda is funded from sales of rhinos and other wildlife as well as tourist operations on the reserve. The reserve also gets great support from several conservation groups such as StopRhinoPoaching.comInternational Rhino Foundation, Cycle is Life, Project Rhino KZN, and WWF-Black Rhino Range Expansion Project, and from private donors. “There’s some government support from programs that assist us with the employment of field rangers from local communities. But these are not sustainable in the long run,” Naylor warns. 
The lack of support from the authorities and judiciary is a constant complaint among private reserve owners and operators. “Criminal syndicates and organized crime behind the poaching are growing stronger; they’re becoming very wealthy and there’s growing suspicion they have some magistrates, public prosecutors, police and other authorities on their payroll, making it very hard to have successful investigations, arrests, and convictions,” Naylor claims. 
photo of a man working with a tranquilized rhinoceros An injured rhino receives treatment for a wound. The cost of caring for and protecting
rhinos like this one has gone up amid the poaching crisis.
Many complain that the sentences meted out to poachers are too light, if cases do go to court at all. The threat of jail is not a deterrent. With large sums of money at their disposal, the crime syndicates are offering money to staff and field rangers at rhino reserves for information and assistance.
The rhino-poaching crisis has also taken a heavy toll on the men and women fighting to safeguard the animals.
“Many, many Africans are suffering mentally and physically. Death is all around, on both sides,” Naylor says. “Many Africans are dying at the hands of unscrupulous criminal syndicate bosses. Too many people comment ‘They are poachers and deserve to die.’ But to others they are fathers, brothers, and sons, and their deaths are in vain and to serve the greed of those more powerful. We are also starting to see the effects of post-traumatic stress on our field rangers and conservation staff. Long hours, stress and the constant threat of violence and death are taking their toll.”
A recent World Wildlife Fund poll that looked at field rangers across Africa found that more than 65 percent of them had been attacked by poachers and more than 70 percent had been threatened by poachers and local communities. Less than 25 percent get to see their families for more than 10 days a month. And most said they would not want their children to become field rangers.
Vincent Barkas, head of Protrack, one of Southern Africa’s largest private anti-poaching companies, speaks vividly of the horror of poaching scenes. “When you find a poached female that’s pregnant, cut that rhino open, and an almost fully-developed calf falls out, I’ve seen grown men, men with no compassion for rhinos, for whom anti-poaching is just a job, sit down and cry. I saw a calf have to be destroyed once. It’s a noisy animal; when you shoot it, it screams. You don’t forget that.“
Barkas, however, sees the problem in a larger context. “It’s just another way the rest of the world has corrupted Africa with its money. Africans are fighting and killing one another over one of our natural resources which we’ve never had any use for.”
Karen Trendler, South Africa’s leading wildlife rehabilitator, works with baby rhinos orphaned by poaching. She fears the relentless bad news is having a wider impact. “We’re seeing fatigue and burnout throughout the rhino [conservation] community. The guys are tired, they’re worn out. There’s donor fatigue, public fatigue, media fatigue,” she says.
Back at Phinda, Naylor talks of how the sacrifices of anti-poaching staff and conservationists on the front line will amount to little without support at the top from the police and the judiciary. “Sadly, it appears that the political will that needs to be applied will not be forthcoming anytime soon,” he says. “I’m afraid to say that the future of rhinos in South Africa looks bleak.”
Pessimistic he may be, but Naylor isn’t quitting, and, for now, fatigue must wait. There’s work to be done. The white rhino that Naylor’s crew has just dehorned has been given an antidote to the tranquilizer, and is starting to come round. It clambers unsteadily to its feet, shakes its head, then walks slowly off into the bush, apparently none the worse for the experience. For this rhino, at least, the future is a little more secure. 
Ann and Steve Toon are UK-based wildlife photojournalists specializing in Southern Africa.

For further information log on website :
http://www.earthisland.org/journal/index.php/eij/article/at_the_sharp_end

Plastic Bottles and Cave Divers Aid in Quest to Document an Elusive, Subterranean Critter

Author
BY BETSY L. HOWELL – NOVEMBER 29, 2016

The Georgia blind salamander could be an indicator species for the health of the Floridan aquifer, but scientists don’t know if it’s thriving or declining

“Every biologist thinks his or her species of interest is the canary in the coal mine,” says John Jensen, state herpetologist for the Georgia Department of Natural Resources. “But the Georgia blind salamander, in my opinion, really fits this analogy better than most.” Jensen, who has worked with the species for two decades, explains his reasoning by pointing out the salamander’s habitat: aquifers. “It lives in the groundwater — groundwater that we rely on for drinking. If we are seeing declines or disappearances of blind salamanders, then we should be very alarmed.”

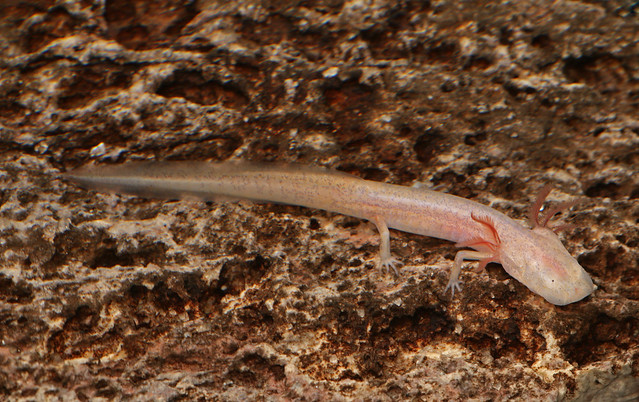
photo of Georgia Blind Salamander

Photo by Jake Scott

The Georgia blind salamander's subterranean habitat makes it difficult to study. As a result, very little is known about the species.  

Yet to know if these salamanders are declining or disappearing, it’s first critical to know where they are, or are not, living in the aquifer. Georgia blind salamanders, along with other “stygobitic” species — that is, species that live in groundwater systems or aquifers, — are some of the most difficult species on earth to find. Scientists know they inhabit the Floridan aquifer, a vast, subterranean network of limestone passageways that underlies much of the southeastern United States, yet information on specific locations of salamanders is hard to obtain. Some parts of this network permit erect walking by humans, while many areas can only be accessed by crawling through “worm holes” — tight passages barely large enough for an adult body. Water-filled rooms and tunnels can only be navigated by scuba diving. The underworld hazards to surveyors are many and varied. There is the potential for getting lost or stuck, running out of air or encountering bad air (generally a result of carbon dioxide buildup from the decomposition of organic matter), or breathing air flecked with the fungal spores that cause histoplasmosis, an infection that can cause fever, coughing, and fatigue.

“Very little is known about this species,” Jensen admits, “beyond their general habitat and morphology. I have only seen blind salamanders in Climax Caverns [in southwest Georgia] and those pools took hours of caving to reach. The animals were in water directly below a southeastern myotis bat roost. The bats had contributed guano to the bottom of the pool, and this dark substrate really helped make the translucent salamanders visible.”
***
Georgia blind salamanders first became known to science in May 1939. That spring, one individual was brought up in a water sample from a 200-foot well in Albany, Georgia. This female salamander had eggs visible in her sheer belly, measured just three inches long, and did not have eyes. With transparent limbs and body, tiny dark spots speckled throughout, and long, delicate, blood-red gills, the animal might have crawled out of the pages of a fairy tale. Or come from another planet. Living in a world of darkness makes sight and coloration unimportant, while the feathery gills help to capture oxygen in slow-moving water. Such characteristics make this species unlike almost all other salamanders.
The blind salamander remained alive in captivity for one week. Unmotivated to eat any food offered, she stayed motionless most of the time on the bottom of the aquarium where she was housed. When she did move, it was by using her limbs, but also by fishlike movements from her body and tail. Vibrations in the room from sounds or activity sent the animal dashing wildly about the aquarium. One week after the salamander had been collected, a fall from the x-ray table killed her before more could be learned and observed and before her young were born. From this discovery, however, came the Latin name for the genus of the Georgia blind salamander, “Haideotriton,” or “salamander of the lower regions.”
***
In April 2010, the Center for Biological Diversity (CBD) petitioned the US Fish & Wildlife Service (USFWS) to list Haideotriton wallacei under the Endangered Species Act. The Center cited two primary threats to the species: Habitat loss from water pollution and water level fluctuation as a result of drawdown of the aquifer for human uses. In 2011, the USFWS published a finding that CBD’s petition presented “substantial scientific or commercial information indicating that listing [of the Georgia blind salamander] may be warranted.” This finding meant that the federal agency would begin a status review to determine if the species should be listed. That review is still being assembled.
The lack of understanding of the blind salamander’s distribution is a concern when trying to determine the level of threat to the species. As Jensen points out, “Although these salamanders may occur in aquifers well away from accessible caves, their densities may not be as great due to the lack of organic matter.” However, no one knows for sure, a fact that makes effective conservation extremely difficult. With the petition from CBD came a wave of interest among Florida and Georgia state wildlife agencies to determine the blind salamander’s status. The question was how does one go about finding a species that inhabits such a challenging environment? The answers can be found in plastic bottles, environmental DNA, and cave divers.
The first method employs plastic soda bottles, weighted and sunk into the aquifer through monitoring wells. The bottles, which are checked daily, are baited with cashews and shrimp to entice the salamanders. This method has captured Texas blind salamanders, however, it took 200 to 300 hours of trapping time to catch two individuals from that species, so fast results are generally not to be had with this survey technique. A recent study done in 2014-2015 involved setting traps in 18 wells in 10 Georgia counties. Though no blind salamanders were caught, 32 Dougherty Plain cave crayfish, another species of concern, came in for the nut and shrimp baits.
photo of Georgia blind salamanderphoto by Alan CresslerThe USFWS is conducting a status review to determine whether the Georgia blind salamander should be listed under the ESA. 
The second strategy involves the remarkable new technology of environmental DNA collection. All living organisms are constantly shedding hair and skin and if these bits can be collected, then matched with reference DNA obtained directly from other individuals of a species, confirmation of presence can be established. The challenges with this method are that one, a species must live in great enough densities to increase the amount of body material available for collection, and two, the collection point needs to be downstream from the animals. If a species is present in an area, but in low numbers and upstream from where water is sampled, the results will be erroneously negative. Georgia blind salamanders have yet to be documented with environmental DNA analysis, though water samples have been taken from wells and springs at numerous locations.
Because of the limitations inherent with these inventory methods, most of the documentation of the species has come from visual observations. People swimming and squeezing their way into these serpentine caves and passageways and taking photographs have confirmed the blind salamander at 36 locations in Georgia and northern Florida. Scientists play a role in this work, but so do cave divers, a small and passionate subset of the greater technical diving community. “They’re not biologists,” says John Jensen, “but they really enjoy having a conservation excuse for doing what they love.” In terms of knowing more about the blind salamanders, it is fortunate they do. Cave divers face similar dangers that regular cavers face, and also have to contend with silt, a limited air supply, and even alligators resting at cave entrances. But for the few involved in this sport, the rewards are many and the privileges of exploring and conserving cave habitats and cave wildlife far outweigh the hazards.
Guy Bryant, a retired pharmacist and computer programmer from Valdosta, Georgia, has been cave diving for 44 years. He can’t remember a time in his life when he wasn’t interested in caves. “Before I began scuba diving,” he says, “I was exploring dry caves, so it was natural that I would incorporate underwater caves into my activities.” Bryant’s cave diving experiences are not for the easily claustrophobic person. One particularly memorable experience came when he and his partner, Lee Sams, were exiting from a tunnel in a place called Thunder Hole. The passage was so tight and the silt so thick that they could see nothing as they followed their exploration line back to the entrance. At one point, Sams, in the lead, became stuck. For five minutes he worked to get through a constriction in the rocks. “Five minutes being stuck,” says Bryant, “doesn’t sound like much, but when you’re 155’ deep and have no visibility trying to get through a tight place, you can use a lot of air.”
This, then, is the world of the Georgia blind salamander, as well as other stygobitic species, such as the Dougherty Plain blind crayfish, the freshwater eel, and the Florida chub. Each cave, according to Bryant, with its unique geology and shape, has its own personality. The type of limestone in the cave, hard or soft, and the amount of impurities, including tannins, provides different coloration for each cave, while the thickness of the limestone can determine whether a cave system becomes deep or stays shallow. The water current inside a cave can make swimming hard or easy and plays a role in how much silt forms on the bottom. Regarding “tight spots,” Bryant says modestly, “Sometimes I’ve had to remove my tanks and push them in front of me to fit through.”
Bryant has seen Georgia blind salamanders in two cave systems: Radium Springs, the largest natural spring in Georgia, and Hole in the Wall Spring, an electrifying blue water world in northern Florida. “In the past,” he says, “we used quartz lights, which would give off a lot of heat. When the salamanders felt this heat, they would take evasive action by swimming upward then spiraling back down. The LED lights we use today don’t give off much heat, so I don’t see them doing this anymore.” What Bryant has seen are the salamanders resting quietly in the silt or rocks along the cave floor, while other wildlife make their presence conspicuously known. At Thunder Hole and another cave called The Cracks, Bryant and his fellow divers have encountered huge numbers of crayfish. “There were so many as we swam through one cave that literally hundreds rained down on us from the ceiling!”
 ***
Not knowing the status of a species while being fully aware it is being adversely affected by pollutants in the aquifer and water drawdown poses challenges in terms of conservation. While John Jensen, his crews, and cave divers document salamanders as best they can, others are thinking ahead to a time when the results of inventories may show the salamanders to be in grave trouble.
Danté Fenolio is the vice president of Conservation and Research at the San Antonio Zoo and has been working with subterranean salamanders for more than 25 years. Beginning with a Master’s project examining the ecology of Grotto Salamanders, also known as “ghost lizards,” in the Ozark Mountains, Fenolio now manages projects examining the status of groundwater fishes and salamanders in China, assembling bioinventories of cave fauna in the Appalachian Mountains and the Ozarks, and working with blind salamanders and crayfish in Georgia, Florida, and Texas. One of his current endeavors includes heading up a team devoted to breeding Georgia blind salamanders in captivity. Conserving subterranean species can be particularly challenging because of an animal’s limited dispersal capabilities and limited alternative habitat available if areas become uninhabitable, either due to natural or anthropogenic causes. “This is the first attempt,” says Fenolio, “to breed and raise these salamanders, and one of the main goals of the program is to develop a set of best practices for their husbandry.” Similar to other programs to conserve imperiled wildlife, the “captive assurance colony” at the San Antonio Zoo is an insurance policy for blind salamanders against environmental catastrophe. Yet, having animals available for release will not be enough to secure the species’ future. Quality habitat must also remain for them to survive long-term, with ample resources available, including food and clean water.
***
In the late 1990s, the US Geological Survey designated the Floridan aquifer “at-risk” due to nitrogen accumulate from fertilizer runoff. Cave-diver Bryant has seen first-hand changes to caves as a result of such input to the system. “More nitrogen causes a decrease in water clarity,” he explains. “I’ve also seen clean walls at one cave change to bacteria and fungus-covered walls from nitrogen.”
The second major threat to the aquifer is its drawdown for human use. The Floridan aquifer supplies daily water needs to several large cities in Georgia and Florida, including Savannah, Tallahassee, Orlando, and St. Petersburg, as well as numerous smaller, rural communities. The aquifer also supplies water for industrial and irrigation purposes. With so many obvious human uses for the water, the needs of other species inhabiting this dark, underground world have gone unnoticed. Jensen notes that most people he talks to don’t even know subterranean salamanders exist. “Some have seen blind cave animals in magazines or on TV shows,” he says, “but they don’t realize we have them right here under our own feet. Heck, they’re even surprised there’s any life at all in aquifers.”
Fenolio agrees that people lack knowledge and understanding of cave wildlife, but he also has hope in a younger generation that values the environment and wants to make a difference. The conservation challenges are great and time is running out for many animals, but the reality of the connectedness of all species remains true today as it has for millennia. “Blind salamanders, as well as all the other species living underground,” says Fenolio, “can’t be untangled from the humans living above them.”

For further information log on website :
http://www.earthisland.org/journal/index.php/elist/eListRead/plastic_bottles_and_cave_divers_aid_in_quest_to_document_an_elusive_subterr

Wolverines Face Recovery Roadblocks

Author
BY JESSE ALSTON – NOVEMBER 21, 2016

Rebounding populations in Pacific Northwest contend with reduced habitat connectivity, climate change

Aja Woodrow plods alongside the road toward a road-killed deer near the town of Cle Elum in central Washington. He’s carrying a Pulaski — a combination axe/grub hoe commonly used for wildland firefighting. Today, however, Woodrow intends to put it to a more macabre use: severing the deer’s head.

This may sound like a scene from horror movie, but Woodrow has wildlife conservation on his mind. He’s a US Forest Service biologist working in partnership with the Washington Department of Transportation on a study of wolverine movement in the North Cascades. Road-killed deer and elk just happen to be effective, cheap, and plentiful wolverine bait.

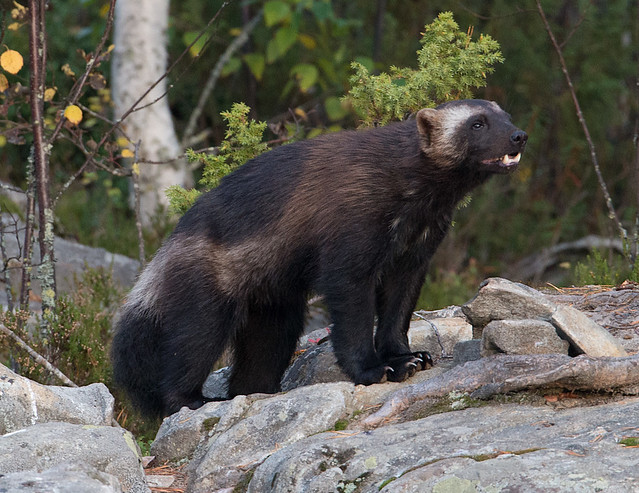
photo of a wolverine

Wildlife biologists are studying the impact Interstate 90, which bisects the Cascade mountain range, on wolverine recovery in the Pacific Northwest. 

Long absent from Washington’s Cascade mountain range, wolverines are staging a comeback. Biologists began documenting wolverines in more remote parts of the Cascades in the 1990s, and in 2006, the Forest Service began tracking wolverines to monitor the depth of the recovery. A decade later, wolverines are flourishing in the area. They’re nearly everywhere we would expect to see them in the North Cascades, and biologists discover new individuals each year. However, a huge barrier lies in the way of the wolverine’s continued recovery and expansion into the rest of the Cascades: Interstate 90, which bisects the mountain range.

Reduced habitat connectivity brought about by infrastructure projects is a growing problem around the world. As humans continue to build infrastructure to make our lives easier, that infrastructure becomes a barrier to movement of wildlife between patches of suitable habitat. This can be particularly problematic for small critters with low mobility like turtles, lizards, and salamanders, but it’s a problem for larger, more mobile animals like deer, wolves, and wolverines as well.
Adam Ford, an assistant professor of biology at the University of British Columbia-Okanogan, has studied the impact of roads on everything from leopard frogs to mountain lions. With some notable exceptions (e.g. the proverbial deer in the headlights), animals tend to shy away from roads, he says.
“Animals can hear cars, they can smell the effluents from cars, and of course they see them moving,” Ford says, all of which can cause animals to be averse to crossing roads. “Generally speaking, the wider the road, the more traffic on it and the larger the zone of influence the road has on the surrounding environment.”
Overpasses and underpasses intended to facilitate wildlife crossings have become increasingly common components of highway construction and maintenance plans. According to Ford, that’s for good reason.
“There are a lot of things that people have tried, and they vary in their efficacy, but the gold standard in mitigation is fencing and crossing structures, because then we get animals across the road safely for them and drivers, we resolve that connectivity issue, and we also resolve the mortality issue at the same time.”
Still, there are gaps in our knowledge of how animals interact with roads. Wolverines pose a particular problem for scientists seeking to study how wildlife respond to roadways because they’re uncommon and typically live in high elevation wilderness without many roads.  
“In our Banff research, we’ve identified a group of species that we call HELS, or high-elevation localized species. Basically, goats, pikas, marmots, and wolverines, which typically don’t encounter roads as part of their home range,” says Ford. “We don’t know much about their interaction with roads because it just doesn’t happen that often.”
Dispersal is already a difficult challenge for species like wolverines that live on mountain peaks because of the rough terrain and tremendous distances that often separate populations and even individuals. Roads might make dispersal nigh on impossible. Knowing how roads impact these species and how we can mitigate that impact might be the difference between healthy populations and local extinction. In the case of Washington’s wolverines, it might determine whether they ever make it to the vast expanse of prime habitat waiting just south of I-90.
Woodrow, the Pulaski-wielding biologist, is doing his best to fill that knowledge gap. He’s using a network of fifteen remote cameras covering an area of hundreds of square miles to find out how significant a barrier I-90 actually is to wolverines in Washington.
Woodrow’s camera set-up is specially designed to capture pictures of wolverines. Each camera faces a “run-pole,” a homemade wooden device mounted to a tree seven to eight feet above the ground, with a deer head or limb dangling barely out of reach at the end. This run-pole forces the wolverine to move through a gauntlet of alligator clips that capture hair used for DNA analysis, then bare its chest to the camera. Wolverines sport unique blazes on their chests, equivalent to furry fingerprints, which allow researchers to identify individuals even if the DNA analysis fails.
Thus far, Woodrow has found Interstate 90 to be a formidable barrier to wolverines. “I ran cameras last winter and the winter before, and I had wolverines on the north side of the interstate, but not the south side,” he says. “We’ve got traffic volumes of one car per second, and the forecasts are for increasing flow… The [Department of Transportation] is in the process of widening [I-90] from two lanes each way to three lanes each way, which is going to further cause isolation between north and south.”
Despite the growing barrier, there is reason for hope. Plans are in the works for a series of wildlife crossing structures in the area. All told, 27 crossing structures are set to be installed in a fifteen-mile stretch near Snoqualmie Pass that connects the vast wilderness areas of the North Cascades to large chunks of undeveloped public land to the south. Construction on the first overpass began in September.
In addition, biologists affiliated with the US Forest Service and the University of California-Davis captured pictures of a wolverine three times on remote cameras southwest of Naches, Washington earlier this year. It’s only the second time in recent decades that a wolverine has been confirmed in Washington south of I-90. It’s too early to tell if that wolverine has stayed in the area, but it’s still an exciting development.
“The south Cascades — that’s habitat that’s just waiting [for wolverines],” says Woodrow. “It’ll be really interesting to see how related that wolverine is to the wolverines that I have north of I-90.”
Despite its proximity to Woodrow’s study area, there’s no guarantee it descended from North Cascades stock. Several wolverine sightings south of his project area have made news in recent years, but none appear to have dispersed from the North Cascades population. Three wolverines were sighted in northeastern Oregon in 2011, but only one was found the next winter. Tracks were found in 2013, but no sightings have been reported since. DNA tests of hair from the 2012 wolverine revealed that it descended from Idaho’s population rather than Washington’s. A lone wolverine also inhabits Tahoe National Forest in California. First sighted in 2008, it was most recently photographedearlier this year.
Despite their sustained range expansion and efforts to connect new habitat to their current range, wolverines aren’t out of danger yet.  Population numbers are still low: Biologists estimate that there are only 300 wolverines in the contiguous United States. Wolverines are also expected to be among the species hardest hit by climate change in the coming years. As our climate warms, suitable patches of wolverine habitat are likely to shrink and distances between these patches will grow. Wolverines seem to rely heavily on deep snowpack that persists into late spring for reproduction. Thermal protection afforded by snowpack and the ability to cache food in snow are suspected as possible reasons for this relationship, though neither has been definitively demonstrated.
In 2013, the threat posed by climate change led the US Fish and Wildlife Service to consider listing wolverines in the Lower 48 as threatened under the Endangered Species Act. The agency ultimately decided against it, but a federal judge demanded in April that the USFWS reconsider its decision, again citing climate change as a dire threat to the species’ long-term persistence. That reassessment is still in the works.
Taken together, these factors render wolverine conservation a complex story, one of promising range expansion paired with new, uncertain threats. It’s a vexing problem for biologists like Woodrow.
“In fifty years, that’s a big question,” he says. “What’s wolverine habitat going to look like in fifty years?”  
Regardless of what it looks like, habitat connectivity projects like the one in Washington are key to helping wolverines and other wildlife adjust to our uncertain climatic future. And thanks to the efforts of hard-working biologists like Woodrow and Ford, wolverines are much more certain to have a continued place in the Cascades ecosystem.

For further information log on website :
http://www.earthisland.org/journal/index.php/elist/eListRead/wolverines_face_roadblocks_recovery

Simulation Models as Tools for Crop Management

Author

Herman van Keulen 

Abstract

Agricultural production can be defined as the transformation of sun energy in useful organic material in the form of food, feed, and fiber. The transformation requires in principle only limited resources: a piece of land, some seeds from a wanted plant species, some sun and rain, and some human labor. However, the transformation takes place under erratic and unpredictable conditions, as especially the availability and timing of the sun and the rain are extremely difficult, if not impossible to predict, while their effects are modified by the qualities of the land and the interventions of the farmer. Any methodology that would improve the predictability of the availability of the resources and their impact on the performance of the production system could in principle improve that performance and reduce the level of uncertainty. Crop growth simulation models ...
This is an excerpt from the content

References

  1. 1.
    Lentz W (1998) Model applications in horticulture: a review. Sci Hortic 74:151–174CrossRef
  2. 2.
    Van Keulen H (1987) Forecasting and estimating effects of weather on yield. In: Wisiol K, Hesketh D (eds) Plant growth modeling for resource management. CRC Press, Boca Raton, pp 105–124
  3. 3.
    Brouwer R, De Wit CT (1968) A simulation model of plant growth, with special attention to root growth and its consequences. In: Whittington WJ (ed) Root growth. Butterworths, London, pp 224–244
  4. 4.
    De Wit CT (1970) Dynamic concepts in biology. In: Setlik I (ed) Prediction and measurement of photosynthetic productivity. Proceedings of IBP/PP Technical Meeting, Trebon, Pudoc, Wageningen, The Netherlands, pp 17–23
  5. 5.
    De Wit CT, Brouwer R, Penning de Vries FWT (1970) The simulation of photosynthetic systems. In: Setlik I (ed) Prediction and measurement of photosynthetic productivity. Proceedings of IBP/PP Technical Meeting, Trebon, Pudoc, Wageningen, The Netherlands, pp 47–70
  6. 6.
    Sinclair TR, Seligman NG (1996) Crop modelling: from infancy to maturity. Agron J 88:698–703CrossRef
  7. 7.
    Bouman BAM, Van Keulen H, Van Laar HH, Rabbinge R (1996) The ‘School of de Wit’ crop growth simulation models: a pedigree and historical overview. Agr Syst 52:171–198CrossRef
  8. 8.
    Boote KJ, Jones JW, Pickering NB (1996) Potential uses and limitations of crop models. Agron J 88:704–716CrossRef
  9. 9.
    Van Ittersum MK, Leffelaar PA, Van Keulen H, Kropff MJ, Bastiaans L, Goudriaan J (2003) On approaches and applications of the Wageningen crop models. Eur J Agron 18:201–234CrossRef
  10. 10.
    Hammer GL, Kropff MJ, Sinclair TR, Porter JR (2002) Future contributions of crop modelling-from heuristics and supporting decision making to understanding genetic regulation and aiding crop improvement. Eur J Agron 18:15–31CrossRef
  11. 11.
    Rabbinge R, Goudriaan J, Van Keulen H, de Vries Penning FWT, Van Laar HH (eds) (1990) Theoretical production ecology: reflection and prospects. Simulation Monographs. Pudoc, Wageningen, The Netherlands
  12. 12.
    Van Ittersum MK, Ewert F, Heckelei T, Wery J, Alkan Olsson J, Andersen E, Bezlepkina I, Brouwer F, Donatelli M, Flichman G, Olsson L, Rizzoli AE, Van der Wal T, Wien JE, Wolf J (2007) Integrated assessment of agricultural systems – a component-based framework for the European Union (SEAMLESS). Agr Syst 96:150–165CrossRef
  13. 13.
    Seligman NG (1990) The crop model record: promise or poor show? In: Rabbinge R, Goudriaan J, Van Keulen H, Penning de Vries FWT, Van Laar HH (eds) Theoretical production ecology: reflection and prospects. Simulation Monographs. Pudoc, Wageningen, The Netherlands, pp 249–263
  14. 14.
    Cox P (1996) Some issues in the design of agricultural decision support systems. Agr Syst 52:355–381CrossRef
  15. 15.
    Meinke H, Baethgen WE, Carberry PS, Donatelli M, Hammer GL, Selvaraju R, Stőckle CO (2001) Increasing profits and reducing risks in crop production using participatory systems simulation approaches. Agr Syst 70:493–513CrossRef
  16. 16.
    Nelson RA, Holzworth DP, Hammer GL, Hayman PT (2003) Infusing the use of seasonal climate forecasting into crop management in North East Australia using discussion support software. Agr Syst 74:393–414CrossRef
  17. 17.
    McCown RL, Hammer GL, Hargreaves JNG, Holzworth DP, Freebairn DM (1996) APSIM: a novel software system for model development, model testing and simulation in agricultural systems research. Agr Syst 50:255–271CrossRef
  18. 18.
    Keating BA, Carberry PS, Hammer GL, Probert ME, Robertson MJ, Holzworth D, Huth NI, Hargreaves JNG, Meinke H, Hochman Z, McLean G, Verburg K, Snow V, Dimes JP, Silburn M, Wang E, Brown D, Bristow KL, Asseng S, Chapman S, McCown RL, Freebairn DM, Smith CJ (2003) An overview of APSIM, a model designed for farming analysis simulation. Eur J Agron 18:267–288CrossRef
  19. 19.
    Stöckle CO, Donatelli M (1997) The CropSyst model: a brief description. In: Plentinger MC, Penning de Vries FWT (eds) Rotation models for ecological farming, pp 35–43 (Quantitative Approaches in Systems Analysis No. 10, AB-DLO). Wageningen, The Netherlands
  20. 20.
    Stöckle CO, Donatelli M, Nelson R (2003) CropSyst, a cropping systems simulation model. Eur J Agron 18:289–307CrossRef
  21. 21.
    Brisson N, Gary C, Justes E, Roche R, Mary B, Ripoche D, Zimmer D, Sierra J, Bertuzzi P, Burger P, Bussière F, Cabidoche YM, Cellier P, Debaeke P, Gaudillère JP, Hénault C, Maraux F, Seguin B, Sinoquet H (2003) An overview of the crop model STICS. Eur J Agron 18:309–332CrossRef
  22. 22.
    Jones JW, Hoogenboom G, Porter CH, Boote KJ, Batchelor WD, Hunt WA, Wilkens PW, Singh U, Gijsman AJ, Ritchie JT (2003) The DSSAT cropping system model. Eur J Agron 18:235–265CrossRef
  23. 23.
    Van Keulen H, Stol W (1995) Agro-ecological zonation for potato production. In: Haverkort AJ, MacKerron DKL (eds) Potato ecology and modelling of crops under conditions limiting growth. Kluwer, Dordrecht, The Netherlands, pp 357–371CrossRef
  24. 24.
    Penning de Vries FWT, Van Keulen H, Rabbinge R (1995) Natural resources and limits of food production in 2040. In: Bouma J, Kuyvenhoven A, Bouman BAM, Luyten J, Zandstra HG (eds) Eco-regional approaches for sustainable land use and food production. Kluwer, Dordrecht, The Netherlands, pp 65–87
  25. 25.
    Van Ittersum MK, Rabbinge R (1997) Concepts in production ecology for analysis and quantification of agricultural input-output combinations. Field Crops Res 52:197–208CrossRef
  26. 26.
    Hengsdijk H, Van Ittersum MK (2002) A goal-oriented approach to identify and engineer land use systems. Agr Syst 71:231–247CrossRef
  27. 27.
    Rabbinge R, Van Latesteijn HC (1992) Long term options for land use in the European Community. Agr Syst 40:195–210CrossRef
  28. 28.
    Ten Berge HFM, Van Ittersum MK, Rossing WAH, Van de Ven GWJ, Schans J, Van de Sanden PACM (2000) Farming options for the Netherlands explored by multi-objective modelling. Eur J Agron 13:263–277CrossRef
  29. 29.
    Roetter R, Van Keulen H, Van Laar HH (2000) Synthesis of methodology development and case studies, vol 3, Sysnet Research Paper Series. International Rice Research Institute, Los Banos, Philippines, p 94
  30. 30.
    Dogliotti S, Rossing WAH, Van Ittersum MK (2004) Systematic design and evaluation of crop rotations enhancing soil conservation, soil fertility and farm income: a case study for vegetable farms in South Uruguay. Agr Syst 80:277–302CrossRef
  31. 31.
    Dogliotti S, Van Ittersum MK, Rossing WAH (2005) A method for exploring sustainable development options at farm scale: a case study for vegetable farms in South Uruguay. Agr Syst 86:29–51CrossRef
  32. 32.
    Van de Ven GWJ, Van Keulen H (2007) A mathematical approach to comparing environmental and economic goals in dairy farming: identifying strategic development options. Agr Syst 94:231–246CrossRef
  33. 33.
    Hengsdijk H, Bouman BAM, Nieuwenhuyse A, Jansen HGP (1999) Quantification of land use systems using technical coefficient generators: a case study for the northern Atlantic zone of Costa Rica. Agr Syst 61:109–121CrossRef
  34. 34.
    Laborte AG, Schipper RA, Van Ittersum MK, Van Den Berg MM, Van Keulen H, Prins AG, Hossain M (2009) Farmers’ welfare, food production and the environment: a model-based assessment of the effects of new technologies in the northern Philippines. NJAS Wageningen J Life Sci 6:345–373CrossRef
  35. 35.
    Hengsdijk H, Guanghuo W, Van den Berg MM, Jiangdi W, Wolf J, Changhe L, Roetter RR, Van Keulen H (2007) Poverty and biodiversity trade-offs in rural development: a case study for Pujiang county, China. Agr Syst 94:851–861CrossRef
  36. 36.
    Ponsioen TC, Hengsdijk H, Wolf J, Van Ittersum MK, Rötter RP, Son TT, Laborte AG (2006) TechnoGIN, a tool for exploring and evaluating resource use efficiemcy of cropping systems in East and Southeast Asia. Agr Syst 87:80–100CrossRef
  37. 37.
    Abrecht DG, Robinson SD (1996) TACT: a tactical decision aid using a CERES based wheat simulation model. Ecol Model 86:241–244CrossRef
  38. 38.
    Stone RC, Meinke H (2005) Operational seasonal forecasting of crop performance. Philos Trans Roy Soc B 360:2109–2124CrossRef
  39. 39.
    Muchow RC, Bellamy JA (eds) (1991) Climatic risk in crop production: models and management for the semiarid tropics and subtropics. CAB International, Wallingford, UK, p 548
  40. 40.
    Stone RC, Hammer GL, Marcussen T (1996) Prediction of global rainfall probabilities using phases of the Southern Oscillation Index. Nature 384:252–255CrossRef
  41. 41.
    Hammer GL, Nicholls N, Mitchell C (eds) (2000) Applications of seasonal climate forecasting in agricultural and natural ecosystems – the Australian experience. Kluwer, Dordrecht, The Netherlands, p 469
  42. 42.
    Carberry PS (2001) Are science rigour and industry relevance both achievable in participatory action research? Proceedings Australian Agronomy Conference, Hobart, January 2001. Available from http://​www.​regional.​org.​au/​papers/​agronomy/​2001/​plenery/​5/​Carberry,Peter.​htm
  43. 43.
    Nelson RA, Hammer GL, Holzworth DP, McLean G, Pinington GK, Frederiks AN (1999) User’s Guide for Whopper Cropper (CD-ROM) Version 2.1. QZ99013. Department of Primary Industries, Queensland, Brisbane, Australia
  44. 44.
    Hammer GL (2000) Applying seasonal climate forecasts in agricultural and natural ecosystems – a synthesis. In: Hammer GL, Nicholls N, Mitchell C (eds) Applications of seasonal climate forecasting in agricultural and natural ecosystems – the Australian experience. Kluwer, Dordrecht, The Netherlands, pp 453–462CrossRef
  45. 45.
    Messina CD, Hansen JW, Hall AJ (1999) Land allocation conditioned on El Niño-Southern Oscillation phases in the Pampas of Argentina. Agr Syst 60:197–212CrossRef
  46. 46.
    Hansen JW, Indeje M (2004) Linking dynamic seasonal climate forecasts with crop simulation for maize yield prediction in semi-arid Kenya. Agr Forest Meteorol 125:143–157CrossRef
  47. 47.
    Wopereis MCS, Bouman BAM, Tuong TP, Ten Berge HFM, Kropff MJ (1996) ORYZA_W: Rice growth model for irrigated and rainfed environments. SARP Research Proceedings, AB-DLO, Wageningen, The Netherlands, p 159
  48. 48.
    Lansigan FP, Pandey S, Bouman BAM (1997) Combining crop modelling with economic risk-analysis for the evaluation of crop management strategies. Field Crops Res 51:133–145CrossRef
  49. 49.
    MacRobert JF, Savage MJ (1998) The use of a crop simulation model for planning wheat irrigation in Zimbabwe. In: Tsuji GY, Hoogenboom G, Thornton PK (eds) Understanding options for agricultural production. Systems approaches for sustainable agricultural development. Kluwer, Dordrecht, The Netherlands, pp 205–220
  50. 50.
    Ko J, Piccinni G, Steglich E (2009) Using EPIC model to manage irrigated cotton and maize. Agr Water Manage 96:1323–1331CrossRef
  51. 51.
    Richards QD, Bange MP, Johnston SB (2008) HydroLOGIC: an irrigation management system for Australian cotton. Agr Syst 98:40–49CrossRef
  52. 52.
    Hearn AB (1994) OZCOT: a simulation model for cotton crop management. Agr Syst 44:257–299CrossRef
  53. 53.
    Ten Berge HFM, Shi Q, Zheng Z, Rao KS, Riethoven JJM, Zhong X (1997) Numerical optimisation of nitrogen application to rice. II. Field evaluations. Field Crops Res 51:43–54CrossRef
  54. 54.
    Ten Berge HFM, Thiyagarajan TM, Shi Q, Wopereis MCS, Drenth H, Jansen MJW (1997) Numerical optimisation of nitrogen application to rice. I. Description of MANAGE-N. Field Crops Res 51:29–42CrossRef
  55. 55.
    Thiyagarajan TM, Stalin P, Dobermann A, Cassman KG, Ten Berge HFM (1997) Soil N supply and plant N uptake by irrigated rice in Tamil Nadu. Field Crops Res 51:55–64CrossRef
  56. 56.
    ZhiMing Z, LiJiao Y, ZhaoQian W, Zheng Z, Yan L, Wang Z (1997) Evaluation of a model recommended for N fertilizer application in irrigated rice. Chin Rice Res Newslett 5:7–8
  57. 57.
    Wang E, Xu JH, Smith CJ (2008) Value of historical climate knowledge, SOI-based seasonal climate forecasting and stored soil moisture at sowing in crop nitrogen management in south eastern Australia. Agr Forest Meteorol 148:1743–1753CrossRef
  58. 58.
    Aggarwal PK, Kalra N, Chander S, Pathak H (2006) InfoCrop: a dynamic simulation model for the assessment of crop yields, losses due to pests, and environmental impact of agro-ecosystems in tropical environments. I. Model description. Agr Syst 89:1–25CrossRef
  59. 59.
    Yadav DS, Chander S (2009) Simulation of rice planthopper damage for developing pest management decision support tools. Crop Prot 29:67–76
  60. 60.
    Fischer A, Kergoat L, Dedieu G (1997) Coupling satellite data with vegetation functional models: review of different approaches and perspectives suggested by the assimilation strategy. Remote Sens Rev 15:283–303CrossRef
  61. 61.
    Moulin S, Bondeau A, Delecolle R (1998) Combining agricultural crop models and satellite observations: from field to regional scales. Int J Remote Sens 19:1021–1036CrossRef
  62. 62.
    Jongschaap REE, Quiroz RA (2000) Integrating remote sensing with process-based simulation models to assess primary production capacity for grazing lands in The Andes. Proceedings of the 5th seminar on GIS and developing countries: GISDECO 2000, Los Baños, Philippines, 2–3 November 2000
  63. 63.
    Clevers JPGW, Vonder OW, Jongschaap REE, Desprats DF, King C, Prévot L, Bruguier N (2002) Using SPOT data for calibrating a wheat growth model under Mediterranean conditions. Agronomie 22:687–694CrossRef
  64. 64.
    Cabelguenne M (1996) Tactical irrigation management using real time EPIC-phase model and weather forecast: experiment on maize. In: ICD-CIID F (ed) Irrigation scheduling from theory to practice (Water Reports). FAO, Rome, Italy, pp 185–193
  65. 65.
    Doorenbos J, Kassam AH (1979) Yield response to water. Irrigation and Drainage Paper No. 33, Food and Agricultural Organisation, Rome, Italy
  66. 66.
    Jones CA, Kiniry JR (1986) CERES-Maize: a simulation model of maize growth and development. Texas A&M University Press, College Station, TX, USA
  67. 67.
    Williams JR, Jones CA, Dyke PT (1984) A modelling approach to determining the relationship between erosion and soil productivity. Trans Am Soc Eng 27:129–144
  68. 68.
    Cabelguenne M, Debaeke Ph, Puech J, Bose N (I997) Real time irrigation management using the EPIC-PHASE model and weather forecasts. Agr Water Manage 32:227–238
  69. 69.
    McGlinchey MG, Inman-Bamber N, Culverwell TL, Els M (1995) An irrigation scheduling method based on a crop model and an automatic weather station. Proceedings of the Annual congress of the South African Sugar Technologists’ Association, vol 69, pp 69–73
  70. 70.
    Plauborg F, Heidmann T (1996) MARKVAND: an irrigation scheduling system for use under limited irrigation capacity in a temperate humid climate. In: ICD-CIID F (ed) Irrigation scheduling from theory to practice (Water Reports). FAO, Rome, pp 177–184
  71. 71.
    Hess TM (1990) Practical experiences of operating a farm irrigation scheduling service in England. Acta Hortic 278:871–878
  72. 72.
    Hess TM (1996) A microcomputer scheduling program for supplementary irrigation. Comput Electron Agr 15:233–243CrossRef
  73. 73.
    Tollefson L (1996) Requirements for improved interactive communication between researchers, managers, extensionists and farmers. In: ICD-CIID F (ed) Irrigation scheduling from theory to practice (Water Reports). FAO, Rome, pp 217–226
  74. 74.
    Ines AVM, Honda K, Das Gupta A, Droogers P, Clemente RS (2006) Combining remote sensing-simulation modeling and genetic algorithm optimization to explore water management options in irrigated agriculture. Agr Water Manage 83:221–232CrossRef
  75. 75.
    Bastiaanssen WGM, Menenti M, Feddes RA, Holtslag AAM (1998) A remote sensing surface energy balance algorithm for land (SEBAL). 1. Formulation. J Hydrol 212–213:198–212CrossRef
  76. 76.
    Hansen JW, Ines AVM (2005) Stochastic disaggregation of monthly rainfall data for crop simulation studies. Agr Forest Meteorol 131:233–246CrossRef
  77. 77.
    Groot JJR, Van Keulen H (1990) Prospects for improvement of nitrogen fertilizer recommendations for cereals: a simulation study. In: Van Beusichem ML (ed) Plant nutrition: physiology and applications. Developments in Plant and Soil Sciences, vol 41. Kluwer, Dordrecht, The Netherlands, pp 685–692
  78. 78.
    Li FY, Johnstone PR, Pearson A, Fletcher A, Jamieson PD, Brown HE, Zyskowskia RF (2009) AmaizeN: a decision support system for optimizing nitrogen management of maize. NJAS Wageningen J Life Sci 57:93–100CrossRef
  79. 79.
    Zadoks JC (1981) EPIPRE: a disease and pest management system for winter wheat developed in The Netherlands. EPPO Bull 11:365–369CrossRef
  80. 80.
    Rabbinge R, Rijsdijk FH (1983) EPIPRE: a disease and pest management system for winter wheat, taking account of micrometeorological factors. EPPO Bull 13:297–305CrossRef
  81. 81.
    Smeets E, Vandenriessche H, Hendrickx G, De Wijngaert K, Geypens M (1992) Photosanitary balance of winter wheat in 1992 by the EPIPRE advice system. Parasitica 48:139–148
  82. 82.
    Djurle J (1988) Experience and results from the use of EPIPRE in Sweden. SROP Bulletin. In: Pest and disease models in forecasting crop loss appraisal and decision supported crop protection systems, vol 11, pp 94–95
  83. 83.
    Forrer HR (1988) Experience and current status of EPIPRE in Switzerland. SROP Bulletin. In: Pest and disease models in forecasting crop loss appraisal and decision supported crop protection systems, vol 11, pp 91–93
  84. 84.
    Macadam R, Britton I, Russell D, Potts W, Baillie B, Shaw A (1990) The use of soft systems methodology to improve the adoption by Australian cotton growers of the Siratac computer-based crop management system. Agr Syst 34:1–14CrossRef
  85. 85.
    Hamilton WD, Woodruff DR, Jamieson AM (1991) Role of computer-based decision aids in farm decision-making and in agricultural extension. In: Muchow RD, Bellamy JA (eds) Climatic risk in crop production-models and management for the semi-arid tropics and subtropics. CAB International, Wallingford, UK, pp 411–423
  86. 86.
    Roetter RP, Hoanh CT, Laborte AG, Van Keulen H, Van Ittersum MK, Dreiser C, Van Diepen CA, De Ridder N, Van Laar HH (2005) Integration of Systems Network (SysNet) tools for regional land use scenario analysis in Asia. Environ Model Softw 20:291–307CrossRef
  87. 87.
    Roetter RP, Laborte AG, Van Keulen H (2000) Using SysNet tools to quantify the trade-off between food production and environmental quality. International Rice Research Newsletter, December 2000:4–9
  88. 88.
    Van Ittersum MK, Roetter RP, Van Keulen H, De Ridder N, Hoanh CT, Laborte AG, Aggarwal PK, Ismail AB, Tawang A (2004) A systems network (SysNet) approach for interactively evaluating strategic land use options at sub-national scale in South and South-east Asia. Land Use Policy 21:101–113CrossRef
  89. 89.
    Van Keulen H (2007) Quantitative analyses of natural resource management options at different scales. Agr Syst 94:768–783CrossRef
  90. 90.
    Van Paassen A, Roetter RP, Van Keulen H, Hoanh CT (2007) Can computer models stimulate learning about sustainable land use? Experience with LUPAS in the humid (sub-) tropics of Asia. Agr Syst 94:874–887CrossRef
  91. 91.
    Sterk B, Carberry P, Leeuwis C, Van Ittersum MK, Howden M, Meinke H, Van Keulen H, Rossingh WAH (2009) The interface between land use systems research and policy: multiple arrangements and leverages. Land Use Policy 26:434–442CrossRef
  92. 92.
    David A (2001) Models implementation: a state of the art. Eur J Oper Res 134:459–480CrossRef
  93. 93.
    Rykiel EJ Jr, Berkson J, Brown VA, Krewitt W, Peters I, Schwartz M, Shogren J, Van der Molen D, Blok R, Borsuk M, Bruins R, Cover K, Dale V, Dew J, Etnier C, Fanning L, Felix R, Nordin Hasan M, Hong H, King AW, Krauchi N, Lubinsky K, Olson J, Onigkeit J, Patterson G, Rajan KS, Reichert P, Sharma K, Smith V, Sonnenschein M, St-Louis R, Stuart D, Supalla R, Van Latesteijn H (2002) Science and decision making. In: Costanza R, Jörgensen SE (eds) Understanding and solving environmental problems in the 21st century. Toward a new, integrated hard problem science. Elsevier, Amsterdam, The Netherlands, pp 153–166CrossRef
  94. 94.
    Walker DH (2002) Decision support, learning and rural resource management. Agr Syst 73:113–127CrossRef
  95. 95.
    Carberry PS, Hochman Z, McCown RL, Dalgliesh NP, Foale MA, Poulton PL, Hargreaves JNG, Hargreaves DMG, Cawthray S, Hillcoat N, Robertson MJ (2002) The FARMSCAPE approach to decision support: farmers’, advisers’, researchers’ monitoring, simulation, communication and performance evaluation. Agr Syst 74:141–177CrossRef
  96. 96.
    Hargreaves DMG, Hochman Z, Dalgliesh N, Poulton P (2001) FARMSCAPE online – developing a method for interactive Internet support for farmers situated learning and planning. In: Proceedings of the Tenth Australian Agronomy Conference, Hobart, Australia. www.​regional.​org.​au/​au/​asa/​2001/​5/​a/​hargreaves.​htm)
  97. 97.
    McCown RL (2002) Changing systems for supporting farmers’ decisions: problems, paradigms, and prospects. Agr Syst 74:179–220CrossRef
  98. 98.
    Twomlow S (2001) Linking Logics II: taking simulation models to the farmers. British Society of Soil Science Newsletter, December 2001 (40):12–14
  99. 99.
    Carberry PS, Hochman Z, Hunt JR, Dalgliesh NP, McCown RL, Whish PM, Robertson MJ, Foale MA, Poulton MA, van Rees H (2009) Re-inventing model-based decision support with Australian dryland farmers. 3. Relevance of APSIM to commercial crops. Crop Pasture Sci 60:1044–1056CrossRef
  100. 100.
    Dalgliesh NP, Foale MA, McCown RL (2009) Re-inventing model-based decision support with Australian dryland farmers. 2. Pragmatic provision of soil information for paddock-specific simulation and farmer decision making. Crop Pasture Sci 60:1031–1043CrossRef
  101. 101.
    McCown RL, Carberry PS, Hochman Z, Dalgliesh NP, Foale MA (2009) Re-inventing model-based decision support with Australian dryland farmers. 1. Changing intervention concepts during 17 years of action research. Crop Pasture Sci 60:1017–1030CrossRef
  1. European Journal of Agronomy (2003) Volume 18, Issues 3–4, special issue Modelling Cropping Systems: Science, Software and Applications. pp 187–393
  2. Gary C, Heuvelink E (1998) Advances and bottlenecks in modelling crop growth: summary of a group discussion. Acta Hortic (ISHS) 456:101–104
  3. Goudriaan J, Van Laar HH (1994) Modelling potential crop growth processes, textbook with exercises. Current Issues in Production Ecology, vol 2. Kluwer, Dordrecht, The Netherlands, p 238
  4. Jongschaap REE (2006) Integrating crop growth simulation and remote sensing to improve resource use efficiency in farming systems. Ph.D. thesis, Wageningen University, Wageningen, The Netherlands
  5. Leffelaar PA (ed) (1993) On system analysis and simulation of ecological processes, with examples in CSMP and FORTRAN. Current Issues in Production Ecology, vol 1. Kluwer, Dordrecht, The Netherlands, p 294
  6. Matthews RB, Stephens W (2002) Crop-soil simulation models: applications in developing countries. CAB International, Wallingford, UKCrossRef
  7. Roetter RP, Van Keulen H, Kuiper M, Verhagen J, Van Laar HH (eds) (2007) Science for agriculture and rural development in low-income countries. Springer, Dordrecht, The Netherlands, p 222
  8. Willocquet L, Savary S, Fernandez L, Elazegui FA, Castilla N, Zhu D, Tang Q, Huang S, Lin X, Singh HM, Srivastava KA (2002) Structure and validation of RICEPEST, a production situation-driven, crop growth model simulating rice yield response to multiple pest injuries for tropical Asia. Ecol Model 153:247–268CrossRef
  9. Wolf J, Van Ittersum MK (2009) Crop models: main developments, their use in CGMS and integrated modeling. Agro-Informatica 22:15–18

For further details log on website :
http://link.springer.com/referenceworkentry/10.1007/978-1-4419-0851-3_300

Advantages and Disadvantages of Fasting for Runners

Author BY   ANDREA CESPEDES  Food is fuel, especially for serious runners who need a lot of energy. It may seem counterintuiti...