Author
M. BraşoveanuI; M. R. NemţanuI, *; D. DuţăII
INational Institute for Laser, Plasma and Radiation Physics, Electron Accelerator Laboratory, 409 Atomistilor St., P.O. Box MG-36, RO-077125, Bucharest-Măgurele, Romania. Phone: + 40-21-457-44-89, Fax: + 40-21-457-42-43, E-mail: monica.nemtanu@inflpr.ro
IINational Institute for Food Bioresources, 6 Dinu Vintila St., 021102 Bucharest, Romania
ABSTRACT
The properties of starch can be modified by a variety of methods in order to meet desirable technological needs. Electron beam irradiation is able to induce changes in starch properties. The paper deals with investigation of physicochemical and structural modifications of corn starch processed by electron beam up to 50 kGy and evaluation of the technical-economic aspects of starch processing. Paste viscosity, pasting and peak temperatures decreased in a dose-dependent manner, indicating degradation of the macromolecule. Small circular perforations on the granule surface were observed for 50-kGy irradiated sample. Spectral characteristics suffered minor changes, suggesting that the inter- and intramolecular hydrogen bond stability was affected by the electron beam. These modified starches could find applications in foodstuffs requiring low-viscosity starch. A cost estimate of the electron beam processing of corn starch with an average absorbed dose of 30 kGy showed an increase of corn starch price by 16%.
Keywords: Acidity; Pasting properties; Structure; Processing capacity; Processing costs.
INTRODUCTION
Starch is widely used in various industrial food and non-food applications. Its natural properties like swelling, gelatinisation, viscosity, sticking, film formation, biodegradability or hydrophilicity determine the multitude of its industrial applications (Mischnick, 2005). The selection of starches for certain types of processing is very important because it influences the processing, the attributes and the shelf life of the product in which it was incorporated. For instance, native starch may continue to hydrate even after food processing and thus leads to a viscosity increase or can cause a phenomenon of delayed retrogradation and, in both cases, the products become unsuitable for consumption. To solve the inconveniences caused by the limitations of the native starch functionality, modified starch with improved functional properties is generally preferred.
Beside gamma rays, electron beams are often used in material processing by direct and/or indirect action of electrons, generating reactive entities such as free radicals. Electron beam irradiation is also an economically viable, efficient and rapid method to enhance food safety and quality, having several useful effects depending on the irradiation dose. Consequently, the Joint FAO/IAEA/WHO Study Group (WHO, 1999) suggested that any dose above 10 kGy can be considered both safe to consume and nutritionally adequate if it is appropriate to achieve the intended technological objective. At the same time, according to the EU legislation (Directive 1999/2/EC) related to the manufacture, marketing and importation of foods and food ingredients treated with ionizing radiation, the final decision regarding the implementation of a technology is basically made by the producer and it may be authorized in accordance with the legislation in force only if the following conditions are completely fulfilled: (i) there is a reasonable technological need, (ii) it presents no health hazard and is carried out under the conditions proposed, (iii) it is of benefit to the consumer, (iv) it is performed with electrons generated from machine sources operated at or below a nominal energy (maximum quantum energy) level of 10 MeV, and (v) it is not used as a substitute for hygiene and health practices or for good manufacturing or agricultural practice.
In the last five years, the electron beam processing of starches from different botanical sources was reported to be efficient in order to induce different changes in their physicochemical and structural properties, such as an increase of solubility and free acidity, decreases in swelling capacity, pasting properties, intrinsic viscosity, molecular weight and degree of polymerization (Kamal et al., 2007; Nemţanu et al., 2007; Nemtanu and Brasoveanu, 2010; Nemţanu et al., 2010; Pimpa et al., 2007; Shishonok et al., 2007). Although the electron beam induced modifications have generally similar tendencies, they are different quantitatively, depending on the specificity of each starch and irradiation dose (Nemtanu and Brasoveanu, 2010). Modification of functional properties using electron beams can increase the use of starch in various applications such as in the food, pharmaceutical, paper and textile industries.
Moreover, starch processing using electron accelerator facilities is fast, low cost and environmentally friendly - without any use of polluting agents, catalysts or generation of undesirable residual products (Nemtanu and Brasoveanu, 2010). Therefore, the use of starch modified by electron beam treatment could lead to the opportunity for development of innovative products, reducing product processing costs or extending product shelf life.
The purpose of the present study was: (1) to point out some novel aspects related to the properties of corn starch processed by electron beam in order to be used for varied food applications requiring low-viscosity starch, and (2) to present and discuss an evaluation of technical and economic aspects of electron beam processing of corn starch, which is based on the processing capacity of the electron accelerator technological facility, as well as on the specific cost of processing.
EXPERIMENTAL
Electron Beam Processing
Corn starch from a local commercial market was used for the experiments. The packed starch samples (thickness of 49 mm, area of 50 mm x 80 mm) were treated with a scanned electron beam (EB) using a linear accelerator of mean energy of 6 MeV (NILPRP, Bucharest-Magurele, Romania), at ambient temperature and normal pressure. The absorbed doses (10 - 50 kGy) with mean dose rate of 2 kGy/min were checked using cellulose triacetate film. The configuration of the samples and their positioning in the beam field, at 500 mm distance from the accelerator exit window, allowed us obtain a dose uniformity above 90%.
Physicochemical Characterisation
The moisture content of samples was determined by gravimetric heating (105 ± 2 °C for 4 h) using 4 - 5 g of sample.
The acidity of the samples was determined by titrating starch suspensions against 0.1 M NaOH solution. The starch suspensions were prepared by suspending 5 g of starch in 50 mL of distilled water with continuous shaking to homogenize the suspensions. The results are expressed in terms of acidity degree representing the volume of 0.1 M NaOH solution required to neutralise the acidity of 100 g of starch, according to the SR 90:2007 Romanian standard.
The ash content of starches was determined according to the SR 90:2007 Romanian standard. Briefly, a sample of corn starch (5 g) was accurately weighed into a weighed porcelain crucible. The sample was calcined over a gas burner with low flame initially and then with a strong one. A few drops of hot water or nitric acid were added to the crucible after cooling if coal black dots were still visible. The sample was further evaporated on a water bath and heated until a gray ash without black dots was obtained. The crucible was cooled in a desiccator for 30 min and then weighed. The calcination and weighing were repeated until constant weight. The percentage of ash content was calculated as:

The protein content was determined by the Kjeldahl method according to the SR EN ISO 20483:2007 standard. Starch (2 g) was inserted into a 300 mL Kjeldahl flask. Then 20-25 mL of concentrated sulphuric acid, 2 drops of mercury, some paraffin and 8-10 g potassium sulphate were added. The flask was heated with low flame initially and then gradually higher flame until the liquid became slightly yellowish or colourless and clear. The disaggregation was considered completed after 3-4 hours. The flask was then cooled and the content diluted with 100 ml of distilled water and transferred quantitatively into a 1000 mL Erlenmeyer flask. The volume was completed to 250 mL and a few drops of phenolphthalein were added. Then 80 mL of 30% sodium hydroxide solution, 10 mL of sodium sulphide, several grains of zinc and pumice stone or glass were added. The flask was connected with a distillation apparatus. The conical flask received 30 mL of hydrochloric acid, a few drops of methyl red and distilled water and was then heated until around 200 mL had been distilled. The distillation was interrupted when the amount of 200 mL of distillate was collected. The collector vessel walls were washed with distilled water and the excess hydrochloric acid was titrated with 0.1 M NaOH solution until turning yellow. 1 mL of 0.1 M NaOH solution corresponded to 0.0014 g nitrogen, and 1 g of nitrogen corresponded to 6.25 g of proteins.
The percentage of protein content was calculated as:

where V1 is the volume of 0.1 M HCl introduced into the distillate flask [mL], V2 is the volume of 0.1 M NaOH used for titration [mL] and W is the weight of the starch sample [g].
The fat content of analyzed samples was determined according to the SR 90:2007 Romanian standard. Thus, 10 g of starch were inserted into a paper cartridge filter which was covered with defatted cotton. The cartridge was placed into the tube of a Soxhlet extractor coupled to a weighed flask of the apparatus which was previously filled with 100 ml of ethyl ether and then the refrigerant was fixed. The heating was performed on a water bath for 4 hours. After extraction, the ether was evaporated and the residue was dried in an oven at 95 °C to constant weight. The difference between the final and initial weights of the flask is the amount of fat contained in the starch sample. The percentage of fat content was calculated as:

Pasting properties were monitored with a Brabender Amylograph (Amylograph-E, Brabender, Germany) for starch paste (15%, w/v) in the temperature range of 30-90 °C with a heating rate of 1.5 °C/min, measuring the following parameters: pasting temperature To (°C), peak viscosity temperature Tp (°C), and peak viscosity (BU).
Granule Morphology Evaluation
The analysis of starch granules by scanning electron microscopy (SEM) was performed using a FEI NovaTMNanoSEM 630 microscope.
Fourier Transformed Infrared (FTIR) Spectroscopy
FTIR spectra of starch samples were recorded on a Tensor 27 FTIR spectrometer (Bruker Optik GmbH, Germany) in the frequency range of 4000 - 400 cm-1 using KBr discs prepared from powdered samples mixed with dry KBr and were analyzed with Opus v. 6.5. software.
Statistical Analysis
The results reported are expressed as the means ± standard error of three determinations except for the flow curves. Statistical evaluation of the differences between means was made by using the t-test with P < 0.05 considered statistically significant.
RESULTS AND DISCUSSION
Physicochemical Characterisation
Moisture content, acidity, ash, protein and fat content are characteristics of great interest, especially when new processing methods are investigated for starch.
From the data displayed in Table 1, it can be noted that the starch samples processed by accelerated EB had no significant changes in the physicochemical properties studied, except the acidity and fat content.
The acidity value of EB treated samples increased as the absorbed dose increased. These results are in accordance with previously reported data on EB irradiated sago starch (Pimpa et al., 2007) or gamma-irradiated dry bean starch (Duarte and Rupnow, 1994). Recently, a few works reported that the carboxyl content increased with increasing absorbed dose for gamma-irradiated corn starch (Chung and Liu, 2009), and potato and bean starches (Chung and Liu, 2010; Gani et al., 2012). Thus, the acidity increase with increasing dose could be assigned to the fragmentation of starch molecules and formation of carboxyl-containing compounds. Moreover, EB processing in presence of oxygen determines the appearance of free radicals, aldehydes, ketones, organic peroxides or other polysaccharide degradation products (Ershov, 1998) that can lead to an increase of starch acidity.
Lipids are common minor constituents found in cereal starches, being present both on the surface and inside granules (Morrison, 1988; Kitahara et al., 1994). Corn starch contains mainly internal lipids (Baszczak et al., 2003) which are composed exclu-sively of the lysophospholipids and free fatty acids (Tester et al., 2004). Changes in lipids due to ionizing radiation occur in two ways: (i) direct (radiolytic), when cation radicals or excited lipid molecules are formed; or (ii) indirect (oxidative), by catalyzing their reaction with molecular oxygen, known as autoxidation (Stewart, 2001). The fat content of EB treated corn starch exhibited no changes up to 30 kGy. Thus, the fat content of starch granules showed low sensitivity to the EB in this range of absorbed dose, most likely due to the protective effect of the granular architecture and the solid physical state of the starch treated, which did not allow the diffusion of the free radicals formed, so that the lipid molecules were not easily subject to attack. However, the fat content values decreased in samples processed with doses higher than 30 kGy, indicating a degradation of lipids. Because the EB processing was performed in the presence of oxygen, this degradation might be due to superimposed oxidative and radiolytic effects, which are important at high irradiation doses. The oxidative effect can be minimized by reducing the presence of oxygen during EB processing.
Pasting Properties
The swelling of starch granules during the pasting process has a major effect on the rheological behaviour of starch paste. During the first stage of granule swelling, water penetrates and soaks the granule amorphous phase without any significant alteration of the crystalline phase. The changes of this limited swelling are reversible in successive drying processes because, at temperatures lower than gelatinization, only a small disturbance of the ordered regions of the granule takes place. With an increase of temperature, the soaking of starch granule occurs simultaneously with the water penetration and lateral or tangential swelling of granule. In this case, the process is irreversible due to the loss of crystalline order in the swelled paste and, consequently, to the strongly distortion of the granule architecture.
Pasting profiles of starch samples treated with accelerated EB analyzed with a Brabender amylograph are shown in Fig. 1 and the results are summarized in Table 2.
The overall profile of amylograms showed similar shape for both control sample and EB treated samples. However, a significant decrease in the paste viscosity could be noted as the absorbed dose increased. Also, a gradual decrease of the initial pasting and peak temperatures was observed for all treated samples as the absorbed dose increased in comparison to the control sample. These changes in a dose-dependent manner show that the starch macromolecule was degraded by EB processing. The reduction of the peak viscosity of starch could be assigned to its weaker water binding capacity, granular rigidity and integrity due to glycosidic bond cleavage (Lee et al., 2006; Liu et al., 2012). Therefore, according to Pimpa et al. (2006), the decreased viscosity reveals the inability of amylopectin - responsible for promoting swelling - to hold the granule together when water is imbibed as a consequence of the amylopectin branches cleaved by energy transferred to the molecule from the electron beam.
These starches could find applications in foodstuffs like canned or instant soups, dressings and confectionery products that require lower viscosity. Apart from food products, electron beam modified starch could also find use in paper manufacturing, pharmaceuticals and various other industrial applications.
Granule Morphology
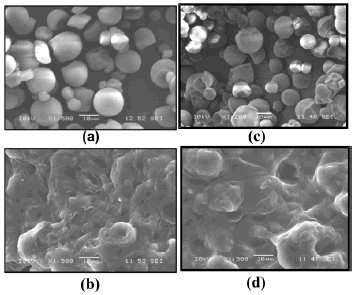
SEM investigation showed that native corn starch had granules of 5-15 µm with a polyhedral shape and a slightly roughened surface, rarely concave, having a tendency to agglomerate as a bunch and occasionally presenting small holes on some granule surfaces (Fig. 2 (a)).
The corn starch samples treated with EB showed fewer agglomerated granules than the control sample granules. The granule shape and sizes were apparently unaffected by EB, but even so the appearance of small circular perforations on the granule surface could be observed for sample treated with 50 kGy (Fig. 2 (b)). Shishonok et al.(2007) reported that the electron beam irradiation did not violate the surface structure of potato starch even at relatively high doses (110 - 440 kGy), while Kamal et al. (2007) showed that the shape of corn starch granule was somewhat deformed by both gamma and electron beams for doses between 5 and 100 kGy. However, a recent study reported that gamma irradiated maize starch retained the original shape and size without any granular cracking or roughness occurring on the surface, even for 500 kGy (Liu et al., 2012).
Accelerated electrons are a kind of penetrating radiation which is able to produce effects in the whole volume of the samples, so that the radioinduced changes may occur both in the central regions and in the peripheral regions of the starch granules. However, the fact that microscopic methods reveal no damage to the granule outer layer leads to the conclusion that the radioinduced changes might occur at a more intimate level of matter in the form of structural changes.
FTIR Spectroscopy
FTIR spectra of native corn starch showed complex vibrational modes due to the pyranose ring of the glycosidic unit in the region below 800 cm-1 (Vasco et al., 1972; Kizil and Seetharaman, 2002).
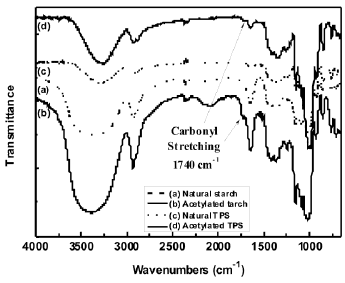
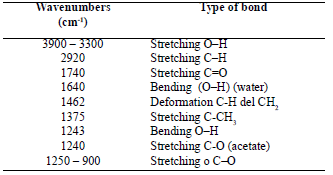
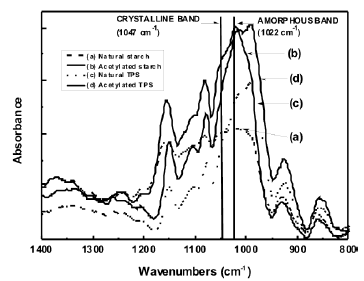
The spectral characteristics of the EB treated samples were similar to native starch (Fig. 3), but with some peaks slightly shifted. These shifts of bands did not indicate any clear and obvious change in the starch structure. However, these minor changes, especially for bands assigned to C-H and O-H bonds, might indicate that the stability of the inter- and intramolecular hydrogen bonds of corn starch structure was affected by EB processing. Liu et al. (2012) also showed that the spectral patterns of highly gamma irradiated maize starches were similar to native starch and no new functional groups were found in the FTIR spectra. Kamal et al. (2007) reported that the IR spectra of the electron beam irradiated corn starch showed that the OH stretching band centred around 3400 cm-1 was affected; an increase in the intensity of the characteristic peak at 1647 cm-1 ascribed to carbonyl groups was also observed.
Most authors have used infrared spectroscopy to estimate the amount of ordered or crystalline regions by analyzing the bands at 1047 and 1022 cm-1. Thus, the crystalline state can be identified by the appearance of a band at 1047 cm-1, while the starch amorphous region is characterized by an absorption band around 1022 cm-1, and their respective ratio indicates the degree of starch order (Cael et al., 1975; Soest et al., 1995; Sevenou et al., 2002; Liu et al., 2004). In our case, the EB processing of corn starch had no influence on this ratio, suggesting that larger crystalline zones might be transformed into small crystallites such that the cristallinity degree was practically unaffected. Abu et al. (2006) reported similar findings on gamma irradiated cowpea starch for which the degree of granule surface order (cristallinity) was not affected up to 50 kGy. On the other hand, the ratio of 1047/1022 decreased with an increase of gamma radiation dose for corn, potato and bean starch, and the granular cristallinity was affected (Chung and Liu, 2009; Chung and Liu, 2010).
Technical and Economic Aspects of Starch Electron Beam Treatment
Due to their construction and functional characteristics, electron accelerators have several advantages, including: full electrical control over the operation and radiation emission; stability and reproducibility of the processing parameters; simplicity of processing control; short duration of processing due to high dose rates; processing in the final stage of the technological flux; clean processing without the use of environmental pollutants, generation of unwanted by-products, and penetration of toxic substances in the treated materials and without any risk of radioactive contamination.
For commercial applications, the most important characteristics of an accelerator are its electron energy and average beam power, parameters that influence the electron path in irradiated material and the processing rate, respectively (Cleland and Parks, 2003). Evaluation of the technical and economic aspects of a technological treatment with electron beam is based on the production capacity of the technological facility and on the specific cost of the processing as well.
Capacity of Starch Processing with Electron Beam
The main technological parameter of an e-beam facility is the processing rate V expressed in kg/s and defined by the following equation:

where η is the yield of beam power use [%], Pbeam is the beam power [kW] and D is the absorbed dose [kGy].
The yield of beam power use is the fraction of the beam energy that turns into used dose:

where Pu is the beam power turned into used dose [kW].
The beam use yield of the technological facilities based on electron accelerators is between 30 and 60% (Korenev, 2004), often around 40% (Morrison, 1989).
At the technological level, other typical parameters for an electron accelerator facility are also used, including:
(i) processing rate per hour and per kGy, Vh,kGy, expressed in :
:

(ii) processing rate per hour, Vh, expressed in kg/h:

Processing capacity (PC) of an electron accelerator based plant depends both on the beam power and yield of beam power use and on the operating system by the number of hours of use per year (Teodorescu and Fiti, 1979). Thus, the value of annual processing capacity of the facility, expressed in tonnes/year, will be:

in which n is the number of hours of accelerator use in order to perform the treatments per year.
To calculate the annual processing capacity, an example is given below by assuming that the treatment is performed with an average absorbed dose of 30 kGy and 6,000 hours per year could be used for treatment, operating three shifts per day. Table 3 shows the values of the most important parameters characterizing electron beam processing in the facility considered.
The processing rate increases with the beam power and the processing capacity of a facility is directly proportional to its processing rate, representing the product of processing rate and the number of hours used for processing. So, when the processing rate is higher, the processing capacity is higher. In our example, the accelerator has a processing rate of 0.80 kg/s and a processing capacity of 17,280 tonnes/year to treat corn starch with an average absorbed dose of 30 kGy. Thus, the beam power determines the amount of product that can be treated in a certain time at the required absorbed dose.
Calculation of Specific Cost of Starch Processing with Electron Beam
Economic profitability of the technological treatment of starch with electron beam is closely related to installation costs, operating costs and specific consumption of electricity. Operating costs depend generally on the required absorbed dose, involving expenses with electricity and the recovery of investment costs (investment amortization), costs of maintenance and regular repair of the facility, staff costs and other specific costs of the envisaged treatment.
Electron accelerators run on electricity, whose cost influences the variable operating costs for a facility based on electron accelerator of great complexity. The amount of electricity used for processing depends on the beam power, yield of beam power use and the conversion factor of the power consumed by the accelerator to obtain an electron beam of a certain power.
For an estimate of specific cost in US$ per ton of corn starch processed with an average absorbed dose of 30 kGy, we considered an annual production of 10,000 tonnes of processed starch and 6,000 operating hours. Table 4presents the percentage values of the operating expenses on which the specific cost of electron beam processing per tonne of product was calculated.
The cost of corn starch processing with electron beam varies from plant to plant depending on the accelerator type and other operating expenses. In our example, it results in a processing cost of 0.08 US$ per kilogram of starch exposed to electron beam with an average absorbed dose of 30 kGy.
Considering that one tonne of native corn starch has a price of approximately 500 US$, after electron beam processing with an average absorbed dose of 30 kGy, the modified starch would cost 580 US$, which means 0.58 US$ per kilogram of corn starch treated with an average absorbed dose of 30 kGy. This estimate showed that EB processing with an average absorbed dose of 30 kGy could increase the price of the native corn starch by about 16%.
CONCLUSIONS
The moisture, protein and ash contents suffered no significant changes upon electron beam processing of corn starch. The acidity increased, while paste viscosity, pasting and peak temperatures decreased as the absorbed dose increased due to the macromolecule degradation. The fat content decreased only for doses higher than 30 kGy. No significant changes appeared in the morphological properties, while the spectral characteristics suffered minor changes, probably because of the sensitivity of inter- and intramolecular hydrogen bonds to the EB processing. Electron beam modified starches could find applications in foodstuffs like canned or instant soups, dressings and confectionery products that require lower viscosity. The irradiation dose required to modify starch to desirable properties can be chosen to meet specific application.
The evaluation of the technical and economic aspects of the corn starch electron beam processing showed that, at a given absorbed dose, the processing capacity of an electron beam facility depended on the processing rate, which was influenced by the beam power and efficiency of its use. The cost of starch electron beam processing depended on the indirect (variable) operating costs and the desired absorbed dose, thus depending on the beam power, the efficiency of its use and the conversion factor of the beam power from the facility consumption power. Our calculation showed that EB processing with an average absorbed dose of 30 kGy increased the price of the native starch by approximately 16%.
ACKNOWLEDGEMENTS
We are grateful to Dr. Adrian Dinescu for the help in recording SEM images of the samples.
This research was partially supported by project PN II 51-007/2007.
REFERENCES
Abu, J. O., Duodu, K. G. and Minaar, A., Effect of γ-irradiation on some physicochemical and thermal properties of cowpea (Vigna Unguiculata L. Walp) starch. Food Chemistry, 95, 386 (2006). [ Links ]
Baszczak, W., Fornal, J., Amarowicz, R. and Pegg, R. B., Lipids of wheat, corn and potato starch. Journal of Food Lipids, 10, 301 (2003). [ Links ]
Cael, J. J., Koenig, J. L. and Blackwell, J., Infrared and Raman spectroscopy of carbohydrates. Part IV: Normal coordinate analysis of V-amylose. Biopolymers, 14, 1885 (1975). [ Links ]
Chung, H. J. and Liu, Q., Effect of gamma irradiation on molecular structure and physicochemical properties of corn starch. Journal of Food Science, 74, C353 (2009). [ Links ]
Chung, H. J. and Liu, Q., Molecular structure and physicochemical properties of potato and bean starches as affected by gamma-irradiation. International Journal of Biological Macromolecules, 47, 214 (2010). [ Links ]
Cleland, M. R. and Parks, L. A., Medium and high-energy electron beam radiation processing equipment for commercial applications. Nuclear Instruments and Methods in Physics Research Section B: Beam Interactions with Materials and Atoms, 208, 74 (2003). [ Links ]
Directive 1999/2/EC of the European Parliament and of the Council of 22 February 1999 on the Approximation of the Laws of the Member States Concerning Foods and Food Ingredients Treated with Ionising Radiation. Official Journal of the European Communities L 66/16 (1999). [ Links ]
Duarte, P. R. and Rupnow, J. H., Gamma-irradiated dry bean (Phaseoulus Vulgaris) starch: Physicochemical properties. Journal of Food Science, 59, 839 (1994). [ Links ]
Ershov, B. G., Radiation-chemical degradation of cellulose and other polysaccharides. Russian Chemical Reviews, 67, 315 (1998). [ Links ]
Gani, A., Bashir, M., Wani, S. M. and Masoodi, F. A., Modification of bean starch by γ-irradiation: Effect on functional and morphological properties. LWT - Food Science and Technology, 49, 162 (2012). [ Links ]
Kamal, H., Sabry, G. M., Lotfy, S., Abdallah, N. M., Ulanski, P., Rosiak, J. and Hegazy, E.-S.A., Controlling of degradation effects in radiation processing of starch. Journal of Macromolecular Science, Part A: Pure and Applied Chemistry, 44, 865 (2007). [ Links ]
Kitahara, K., Suganuma, T. and Nagahama, T., Bound free fatty acids in glucoamylase-digested starches of corn and sweetpotato. Cereal Chemistry, 71, 439 (1994). [ Links ]
Kizil, J. and Seetharaman, K., Characterization of irradiated starches by using FT-Raman and FTIR spectroscopy. Journal of Agricultural and Food Chemistry, 50, 3912 (2002). [ Links ]
Korenev, S., Critical analysis of industrial electron accelerators. Radiation Physics and Chemistry, 71, 535 (2004). [ Links ]
Lee, Y. J., Kim, S. Y., Lim, S. T., Han, S. M., Kim, H. M. and Kang, I. J., Physicochemical properties of gamma-irradiated corn starch. Journal of Food Science and Nutrition, 11, 146 (2006). [ Links ]
Liu, T., Ma, Y., Xue, S. and Shi, J., Modifications of structure and physicochemical properties of maize starch by γ-irradiation treatments. LWT - Food Science and Technology, 46, 156 (2012). [ Links ]
Liu, Y., Himmelsbach, D. S. and Barton, F. E., Two-dimensional Fourier transform Raman correlation spectroscopy determination of the glycosidic linkages in amylose and amylopectin. Applied Spectroscopy, 58, 745 (2004). [ Links ]
Mischnick, P., Structure, chemistry, analysis and physiological aspects of starch and modified starches. Proceedings of Euro Food Chem XIII, vol. 1, 7 (2005). [ Links ]
Morrison, R. M., An economic analysis of electron accelerators and cobalt-60 for irradiating food. Technical Bulletin no. 1762, United States Department of Agriculture, Economic Research Service (1989). [ Links ]
Morrison, W. R., Lipids in cereal starches: A review. Journal of Cereal Science, 8, 1 (1988). [ Links ]
Nemţanu, M. R., Minea, R., Kahraman, K., Koksel, H., Ng, P. K. W., Popescu, M. I. and Mitru, E., Electron beam technology for modifying the functional properties of maize starch. Nuclear Instruments and Methods in Physics Research, Section A: Accelerators, Spectrometers, Detectors and Associated Equipment, 580, 795 (2007). [ Links ]
Nemţanu, M. R. and Braşoveanu, M., Aspects regarding the rheological behavior of wheat starch treated with accelerated electron beam. Romanian Journal of Physics, 55, 111 (2010). [ Links ]
Nemţanu, M. R., Brasoveanu, M. and Iovu, H., Degradation rate of some electron beam irradiated starches. Scientific Bulletin University Politehnica of Bucharest, Series B: Chemistry and Materials Science, 72, 69 (2010). [ Links ]
Nemţanu, M. R. and Braşoveanu, M., Functional properties of some non-conventional treated starches. In: Biopolymers, (Edited by M. Eknashar), p. 319, Scyio, Rijeka, Croatia (2010). [ Links ]
Pimpa, B., Muhammad, S. K. S., Hassan, M. A., Ghazali, Z., Hashim, K. and Kanjanasopa, D., Effect of electron beam irradiation on physicochemical properties of sago starch. Songklanakarin Journal of Science and Technology, 29, 759 (2007). [ Links ]
Sevenou, O., Hill, S. E., Farhat, I. A. and Mitchell, J. R., Organisation of the external region of the starch granule as determined by infrared spectroscopy. International Journal of Biological Macromolecules, 31, 79 (2002). [ Links ]
Shishonok, M. V., Litvyak, V. V., Murshko, E. A., Grinyuk, E. V., Sal'nikov, L. I., Roginets, L. P. and Krul', L. P., Structure and properties of electron beam irradiated potato starch. High Energy Chemistry, 41, 425 (2007). [ Links ]
Soest, J. J. G. van, Tournois, H., Wit, D. De and Vliegenthart, J. F. G., Short-range structure in (partially) crystalline potato starch determined with attenuated total reflectance Fourier-transform IR spectroscopy. Carbohydrate Research, 279, 201 (1995). [ Links ]
SR EN ISO 20483:2007 - Cereals and legumes. Determination of Nitrogen Content and Calculation of Crude Protein Content - Kjeldahl Method. (In Romanian). [ Links ]
SR 90:2007 - Wheat Flour. Analyses Methods (In Romanian). [ Links ]
Stewart, E. M., Food Irradiation Chemistry. In: Food Irradiation: Principles and Applications. Molins, R. (Ed.), John Wiley & Sons, Inc., New York (2001). [ Links ]
Teodorescu, I. E. and Fiti, M., Iradierea Tehnologică. Editura Academiei RSR, Bucureşti (1979). (In Romanian). [ Links ]
Tester, R. F., Karkalas, J. and Qi, X., Starch - composition, fine structure and architecture. Journal Cereal Sciences, 39, 151 (2004). [ Links ]
Vasco, P. D., Blackwell, J. and Koenig, J. L., Infrared and Raman spectroscopy of carbohydrates. Part II: Normal coordinate analysis of α-D-glucose. Carbohydrate Research, 23, 407 (1972). [ Links ]
World Health Organization (WHO), High-Dose Irradiation: Wholesomeness of Food Irradiated with Dose above 10 kGy: Report of a Joint FAO/ IAEA/WHO Study Group. Technical Report Series 890, Geneva, Switzerland (1999). [ Links ]
(Submitted: August 2, 2012 ; Revised: October 29, 2012 ; Accepted: November 7, 2012)
For further details log on website :
http://www.scielo.br/scielo.php?script=sci_arttext&pid=S0104-66322013000400016
M. BraşoveanuI; M. R. NemţanuI, *; D. DuţăII
INational Institute for Laser, Plasma and Radiation Physics, Electron Accelerator Laboratory, 409 Atomistilor St., P.O. Box MG-36, RO-077125, Bucharest-Măgurele, Romania. Phone: + 40-21-457-44-89, Fax: + 40-21-457-42-43, E-mail: monica.nemtanu@inflpr.ro
IINational Institute for Food Bioresources, 6 Dinu Vintila St., 021102 Bucharest, Romania
ABSTRACT
The properties of starch can be modified by a variety of methods in order to meet desirable technological needs. Electron beam irradiation is able to induce changes in starch properties. The paper deals with investigation of physicochemical and structural modifications of corn starch processed by electron beam up to 50 kGy and evaluation of the technical-economic aspects of starch processing. Paste viscosity, pasting and peak temperatures decreased in a dose-dependent manner, indicating degradation of the macromolecule. Small circular perforations on the granule surface were observed for 50-kGy irradiated sample. Spectral characteristics suffered minor changes, suggesting that the inter- and intramolecular hydrogen bond stability was affected by the electron beam. These modified starches could find applications in foodstuffs requiring low-viscosity starch. A cost estimate of the electron beam processing of corn starch with an average absorbed dose of 30 kGy showed an increase of corn starch price by 16%.
Keywords: Acidity; Pasting properties; Structure; Processing capacity; Processing costs.
INTRODUCTION
Starch is widely used in various industrial food and non-food applications. Its natural properties like swelling, gelatinisation, viscosity, sticking, film formation, biodegradability or hydrophilicity determine the multitude of its industrial applications (Mischnick, 2005). The selection of starches for certain types of processing is very important because it influences the processing, the attributes and the shelf life of the product in which it was incorporated. For instance, native starch may continue to hydrate even after food processing and thus leads to a viscosity increase or can cause a phenomenon of delayed retrogradation and, in both cases, the products become unsuitable for consumption. To solve the inconveniences caused by the limitations of the native starch functionality, modified starch with improved functional properties is generally preferred.
Beside gamma rays, electron beams are often used in material processing by direct and/or indirect action of electrons, generating reactive entities such as free radicals. Electron beam irradiation is also an economically viable, efficient and rapid method to enhance food safety and quality, having several useful effects depending on the irradiation dose. Consequently, the Joint FAO/IAEA/WHO Study Group (WHO, 1999) suggested that any dose above 10 kGy can be considered both safe to consume and nutritionally adequate if it is appropriate to achieve the intended technological objective. At the same time, according to the EU legislation (Directive 1999/2/EC) related to the manufacture, marketing and importation of foods and food ingredients treated with ionizing radiation, the final decision regarding the implementation of a technology is basically made by the producer and it may be authorized in accordance with the legislation in force only if the following conditions are completely fulfilled: (i) there is a reasonable technological need, (ii) it presents no health hazard and is carried out under the conditions proposed, (iii) it is of benefit to the consumer, (iv) it is performed with electrons generated from machine sources operated at or below a nominal energy (maximum quantum energy) level of 10 MeV, and (v) it is not used as a substitute for hygiene and health practices or for good manufacturing or agricultural practice.
In the last five years, the electron beam processing of starches from different botanical sources was reported to be efficient in order to induce different changes in their physicochemical and structural properties, such as an increase of solubility and free acidity, decreases in swelling capacity, pasting properties, intrinsic viscosity, molecular weight and degree of polymerization (Kamal et al., 2007; Nemţanu et al., 2007; Nemtanu and Brasoveanu, 2010; Nemţanu et al., 2010; Pimpa et al., 2007; Shishonok et al., 2007). Although the electron beam induced modifications have generally similar tendencies, they are different quantitatively, depending on the specificity of each starch and irradiation dose (Nemtanu and Brasoveanu, 2010). Modification of functional properties using electron beams can increase the use of starch in various applications such as in the food, pharmaceutical, paper and textile industries.
Moreover, starch processing using electron accelerator facilities is fast, low cost and environmentally friendly - without any use of polluting agents, catalysts or generation of undesirable residual products (Nemtanu and Brasoveanu, 2010). Therefore, the use of starch modified by electron beam treatment could lead to the opportunity for development of innovative products, reducing product processing costs or extending product shelf life.
The purpose of the present study was: (1) to point out some novel aspects related to the properties of corn starch processed by electron beam in order to be used for varied food applications requiring low-viscosity starch, and (2) to present and discuss an evaluation of technical and economic aspects of electron beam processing of corn starch, which is based on the processing capacity of the electron accelerator technological facility, as well as on the specific cost of processing.
EXPERIMENTAL
Electron Beam Processing
Corn starch from a local commercial market was used for the experiments. The packed starch samples (thickness of 49 mm, area of 50 mm x 80 mm) were treated with a scanned electron beam (EB) using a linear accelerator of mean energy of 6 MeV (NILPRP, Bucharest-Magurele, Romania), at ambient temperature and normal pressure. The absorbed doses (10 - 50 kGy) with mean dose rate of 2 kGy/min were checked using cellulose triacetate film. The configuration of the samples and their positioning in the beam field, at 500 mm distance from the accelerator exit window, allowed us obtain a dose uniformity above 90%.
Physicochemical Characterisation
The moisture content of samples was determined by gravimetric heating (105 ± 2 °C for 4 h) using 4 - 5 g of sample.
The acidity of the samples was determined by titrating starch suspensions against 0.1 M NaOH solution. The starch suspensions were prepared by suspending 5 g of starch in 50 mL of distilled water with continuous shaking to homogenize the suspensions. The results are expressed in terms of acidity degree representing the volume of 0.1 M NaOH solution required to neutralise the acidity of 100 g of starch, according to the SR 90:2007 Romanian standard.
The ash content of starches was determined according to the SR 90:2007 Romanian standard. Briefly, a sample of corn starch (5 g) was accurately weighed into a weighed porcelain crucible. The sample was calcined over a gas burner with low flame initially and then with a strong one. A few drops of hot water or nitric acid were added to the crucible after cooling if coal black dots were still visible. The sample was further evaporated on a water bath and heated until a gray ash without black dots was obtained. The crucible was cooled in a desiccator for 30 min and then weighed. The calcination and weighing were repeated until constant weight. The percentage of ash content was calculated as:

The protein content was determined by the Kjeldahl method according to the SR EN ISO 20483:2007 standard. Starch (2 g) was inserted into a 300 mL Kjeldahl flask. Then 20-25 mL of concentrated sulphuric acid, 2 drops of mercury, some paraffin and 8-10 g potassium sulphate were added. The flask was heated with low flame initially and then gradually higher flame until the liquid became slightly yellowish or colourless and clear. The disaggregation was considered completed after 3-4 hours. The flask was then cooled and the content diluted with 100 ml of distilled water and transferred quantitatively into a 1000 mL Erlenmeyer flask. The volume was completed to 250 mL and a few drops of phenolphthalein were added. Then 80 mL of 30% sodium hydroxide solution, 10 mL of sodium sulphide, several grains of zinc and pumice stone or glass were added. The flask was connected with a distillation apparatus. The conical flask received 30 mL of hydrochloric acid, a few drops of methyl red and distilled water and was then heated until around 200 mL had been distilled. The distillation was interrupted when the amount of 200 mL of distillate was collected. The collector vessel walls were washed with distilled water and the excess hydrochloric acid was titrated with 0.1 M NaOH solution until turning yellow. 1 mL of 0.1 M NaOH solution corresponded to 0.0014 g nitrogen, and 1 g of nitrogen corresponded to 6.25 g of proteins.
The percentage of protein content was calculated as:

where V1 is the volume of 0.1 M HCl introduced into the distillate flask [mL], V2 is the volume of 0.1 M NaOH used for titration [mL] and W is the weight of the starch sample [g].
The fat content of analyzed samples was determined according to the SR 90:2007 Romanian standard. Thus, 10 g of starch were inserted into a paper cartridge filter which was covered with defatted cotton. The cartridge was placed into the tube of a Soxhlet extractor coupled to a weighed flask of the apparatus which was previously filled with 100 ml of ethyl ether and then the refrigerant was fixed. The heating was performed on a water bath for 4 hours. After extraction, the ether was evaporated and the residue was dried in an oven at 95 °C to constant weight. The difference between the final and initial weights of the flask is the amount of fat contained in the starch sample. The percentage of fat content was calculated as:

Pasting properties were monitored with a Brabender Amylograph (Amylograph-E, Brabender, Germany) for starch paste (15%, w/v) in the temperature range of 30-90 °C with a heating rate of 1.5 °C/min, measuring the following parameters: pasting temperature To (°C), peak viscosity temperature Tp (°C), and peak viscosity (BU).
Granule Morphology Evaluation
The analysis of starch granules by scanning electron microscopy (SEM) was performed using a FEI NovaTMNanoSEM 630 microscope.
Fourier Transformed Infrared (FTIR) Spectroscopy
FTIR spectra of starch samples were recorded on a Tensor 27 FTIR spectrometer (Bruker Optik GmbH, Germany) in the frequency range of 4000 - 400 cm-1 using KBr discs prepared from powdered samples mixed with dry KBr and were analyzed with Opus v. 6.5. software.
Statistical Analysis
The results reported are expressed as the means ± standard error of three determinations except for the flow curves. Statistical evaluation of the differences between means was made by using the t-test with P < 0.05 considered statistically significant.
RESULTS AND DISCUSSION
Physicochemical Characterisation
Moisture content, acidity, ash, protein and fat content are characteristics of great interest, especially when new processing methods are investigated for starch.
From the data displayed in Table 1, it can be noted that the starch samples processed by accelerated EB had no significant changes in the physicochemical properties studied, except the acidity and fat content.
The acidity value of EB treated samples increased as the absorbed dose increased. These results are in accordance with previously reported data on EB irradiated sago starch (Pimpa et al., 2007) or gamma-irradiated dry bean starch (Duarte and Rupnow, 1994). Recently, a few works reported that the carboxyl content increased with increasing absorbed dose for gamma-irradiated corn starch (Chung and Liu, 2009), and potato and bean starches (Chung and Liu, 2010; Gani et al., 2012). Thus, the acidity increase with increasing dose could be assigned to the fragmentation of starch molecules and formation of carboxyl-containing compounds. Moreover, EB processing in presence of oxygen determines the appearance of free radicals, aldehydes, ketones, organic peroxides or other polysaccharide degradation products (Ershov, 1998) that can lead to an increase of starch acidity.
Lipids are common minor constituents found in cereal starches, being present both on the surface and inside granules (Morrison, 1988; Kitahara et al., 1994). Corn starch contains mainly internal lipids (Baszczak et al., 2003) which are composed exclu-sively of the lysophospholipids and free fatty acids (Tester et al., 2004). Changes in lipids due to ionizing radiation occur in two ways: (i) direct (radiolytic), when cation radicals or excited lipid molecules are formed; or (ii) indirect (oxidative), by catalyzing their reaction with molecular oxygen, known as autoxidation (Stewart, 2001). The fat content of EB treated corn starch exhibited no changes up to 30 kGy. Thus, the fat content of starch granules showed low sensitivity to the EB in this range of absorbed dose, most likely due to the protective effect of the granular architecture and the solid physical state of the starch treated, which did not allow the diffusion of the free radicals formed, so that the lipid molecules were not easily subject to attack. However, the fat content values decreased in samples processed with doses higher than 30 kGy, indicating a degradation of lipids. Because the EB processing was performed in the presence of oxygen, this degradation might be due to superimposed oxidative and radiolytic effects, which are important at high irradiation doses. The oxidative effect can be minimized by reducing the presence of oxygen during EB processing.
Pasting Properties
The swelling of starch granules during the pasting process has a major effect on the rheological behaviour of starch paste. During the first stage of granule swelling, water penetrates and soaks the granule amorphous phase without any significant alteration of the crystalline phase. The changes of this limited swelling are reversible in successive drying processes because, at temperatures lower than gelatinization, only a small disturbance of the ordered regions of the granule takes place. With an increase of temperature, the soaking of starch granule occurs simultaneously with the water penetration and lateral or tangential swelling of granule. In this case, the process is irreversible due to the loss of crystalline order in the swelled paste and, consequently, to the strongly distortion of the granule architecture.
Pasting profiles of starch samples treated with accelerated EB analyzed with a Brabender amylograph are shown in Fig. 1 and the results are summarized in Table 2.
The overall profile of amylograms showed similar shape for both control sample and EB treated samples. However, a significant decrease in the paste viscosity could be noted as the absorbed dose increased. Also, a gradual decrease of the initial pasting and peak temperatures was observed for all treated samples as the absorbed dose increased in comparison to the control sample. These changes in a dose-dependent manner show that the starch macromolecule was degraded by EB processing. The reduction of the peak viscosity of starch could be assigned to its weaker water binding capacity, granular rigidity and integrity due to glycosidic bond cleavage (Lee et al., 2006; Liu et al., 2012). Therefore, according to Pimpa et al. (2006), the decreased viscosity reveals the inability of amylopectin - responsible for promoting swelling - to hold the granule together when water is imbibed as a consequence of the amylopectin branches cleaved by energy transferred to the molecule from the electron beam.
These starches could find applications in foodstuffs like canned or instant soups, dressings and confectionery products that require lower viscosity. Apart from food products, electron beam modified starch could also find use in paper manufacturing, pharmaceuticals and various other industrial applications.
Granule Morphology
SEM investigation showed that native corn starch had granules of 5-15 µm with a polyhedral shape and a slightly roughened surface, rarely concave, having a tendency to agglomerate as a bunch and occasionally presenting small holes on some granule surfaces (Fig. 2 (a)).
The corn starch samples treated with EB showed fewer agglomerated granules than the control sample granules. The granule shape and sizes were apparently unaffected by EB, but even so the appearance of small circular perforations on the granule surface could be observed for sample treated with 50 kGy (Fig. 2 (b)). Shishonok et al.(2007) reported that the electron beam irradiation did not violate the surface structure of potato starch even at relatively high doses (110 - 440 kGy), while Kamal et al. (2007) showed that the shape of corn starch granule was somewhat deformed by both gamma and electron beams for doses between 5 and 100 kGy. However, a recent study reported that gamma irradiated maize starch retained the original shape and size without any granular cracking or roughness occurring on the surface, even for 500 kGy (Liu et al., 2012).
Accelerated electrons are a kind of penetrating radiation which is able to produce effects in the whole volume of the samples, so that the radioinduced changes may occur both in the central regions and in the peripheral regions of the starch granules. However, the fact that microscopic methods reveal no damage to the granule outer layer leads to the conclusion that the radioinduced changes might occur at a more intimate level of matter in the form of structural changes.
FTIR Spectroscopy
FTIR spectra of native corn starch showed complex vibrational modes due to the pyranose ring of the glycosidic unit in the region below 800 cm-1 (Vasco et al., 1972; Kizil and Seetharaman, 2002).
The spectral characteristics of the EB treated samples were similar to native starch (Fig. 3), but with some peaks slightly shifted. These shifts of bands did not indicate any clear and obvious change in the starch structure. However, these minor changes, especially for bands assigned to C-H and O-H bonds, might indicate that the stability of the inter- and intramolecular hydrogen bonds of corn starch structure was affected by EB processing. Liu et al. (2012) also showed that the spectral patterns of highly gamma irradiated maize starches were similar to native starch and no new functional groups were found in the FTIR spectra. Kamal et al. (2007) reported that the IR spectra of the electron beam irradiated corn starch showed that the OH stretching band centred around 3400 cm-1 was affected; an increase in the intensity of the characteristic peak at 1647 cm-1 ascribed to carbonyl groups was also observed.
Most authors have used infrared spectroscopy to estimate the amount of ordered or crystalline regions by analyzing the bands at 1047 and 1022 cm-1. Thus, the crystalline state can be identified by the appearance of a band at 1047 cm-1, while the starch amorphous region is characterized by an absorption band around 1022 cm-1, and their respective ratio indicates the degree of starch order (Cael et al., 1975; Soest et al., 1995; Sevenou et al., 2002; Liu et al., 2004). In our case, the EB processing of corn starch had no influence on this ratio, suggesting that larger crystalline zones might be transformed into small crystallites such that the cristallinity degree was practically unaffected. Abu et al. (2006) reported similar findings on gamma irradiated cowpea starch for which the degree of granule surface order (cristallinity) was not affected up to 50 kGy. On the other hand, the ratio of 1047/1022 decreased with an increase of gamma radiation dose for corn, potato and bean starch, and the granular cristallinity was affected (Chung and Liu, 2009; Chung and Liu, 2010).
Technical and Economic Aspects of Starch Electron Beam Treatment
Due to their construction and functional characteristics, electron accelerators have several advantages, including: full electrical control over the operation and radiation emission; stability and reproducibility of the processing parameters; simplicity of processing control; short duration of processing due to high dose rates; processing in the final stage of the technological flux; clean processing without the use of environmental pollutants, generation of unwanted by-products, and penetration of toxic substances in the treated materials and without any risk of radioactive contamination.
For commercial applications, the most important characteristics of an accelerator are its electron energy and average beam power, parameters that influence the electron path in irradiated material and the processing rate, respectively (Cleland and Parks, 2003). Evaluation of the technical and economic aspects of a technological treatment with electron beam is based on the production capacity of the technological facility and on the specific cost of the processing as well.
Capacity of Starch Processing with Electron Beam
The main technological parameter of an e-beam facility is the processing rate V expressed in kg/s and defined by the following equation:

where η is the yield of beam power use [%], Pbeam is the beam power [kW] and D is the absorbed dose [kGy].
The yield of beam power use is the fraction of the beam energy that turns into used dose:

where Pu is the beam power turned into used dose [kW].
The beam use yield of the technological facilities based on electron accelerators is between 30 and 60% (Korenev, 2004), often around 40% (Morrison, 1989).
At the technological level, other typical parameters for an electron accelerator facility are also used, including:
(i) processing rate per hour and per kGy, Vh,kGy, expressed in
 :
:
(ii) processing rate per hour, Vh, expressed in kg/h:

Processing capacity (PC) of an electron accelerator based plant depends both on the beam power and yield of beam power use and on the operating system by the number of hours of use per year (Teodorescu and Fiti, 1979). Thus, the value of annual processing capacity of the facility, expressed in tonnes/year, will be:

in which n is the number of hours of accelerator use in order to perform the treatments per year.
To calculate the annual processing capacity, an example is given below by assuming that the treatment is performed with an average absorbed dose of 30 kGy and 6,000 hours per year could be used for treatment, operating three shifts per day. Table 3 shows the values of the most important parameters characterizing electron beam processing in the facility considered.
The processing rate increases with the beam power and the processing capacity of a facility is directly proportional to its processing rate, representing the product of processing rate and the number of hours used for processing. So, when the processing rate is higher, the processing capacity is higher. In our example, the accelerator has a processing rate of 0.80 kg/s and a processing capacity of 17,280 tonnes/year to treat corn starch with an average absorbed dose of 30 kGy. Thus, the beam power determines the amount of product that can be treated in a certain time at the required absorbed dose.
Calculation of Specific Cost of Starch Processing with Electron Beam
Economic profitability of the technological treatment of starch with electron beam is closely related to installation costs, operating costs and specific consumption of electricity. Operating costs depend generally on the required absorbed dose, involving expenses with electricity and the recovery of investment costs (investment amortization), costs of maintenance and regular repair of the facility, staff costs and other specific costs of the envisaged treatment.
Electron accelerators run on electricity, whose cost influences the variable operating costs for a facility based on electron accelerator of great complexity. The amount of electricity used for processing depends on the beam power, yield of beam power use and the conversion factor of the power consumed by the accelerator to obtain an electron beam of a certain power.
For an estimate of specific cost in US$ per ton of corn starch processed with an average absorbed dose of 30 kGy, we considered an annual production of 10,000 tonnes of processed starch and 6,000 operating hours. Table 4presents the percentage values of the operating expenses on which the specific cost of electron beam processing per tonne of product was calculated.
The cost of corn starch processing with electron beam varies from plant to plant depending on the accelerator type and other operating expenses. In our example, it results in a processing cost of 0.08 US$ per kilogram of starch exposed to electron beam with an average absorbed dose of 30 kGy.
Considering that one tonne of native corn starch has a price of approximately 500 US$, after electron beam processing with an average absorbed dose of 30 kGy, the modified starch would cost 580 US$, which means 0.58 US$ per kilogram of corn starch treated with an average absorbed dose of 30 kGy. This estimate showed that EB processing with an average absorbed dose of 30 kGy could increase the price of the native corn starch by about 16%.
CONCLUSIONS
The moisture, protein and ash contents suffered no significant changes upon electron beam processing of corn starch. The acidity increased, while paste viscosity, pasting and peak temperatures decreased as the absorbed dose increased due to the macromolecule degradation. The fat content decreased only for doses higher than 30 kGy. No significant changes appeared in the morphological properties, while the spectral characteristics suffered minor changes, probably because of the sensitivity of inter- and intramolecular hydrogen bonds to the EB processing. Electron beam modified starches could find applications in foodstuffs like canned or instant soups, dressings and confectionery products that require lower viscosity. The irradiation dose required to modify starch to desirable properties can be chosen to meet specific application.
The evaluation of the technical and economic aspects of the corn starch electron beam processing showed that, at a given absorbed dose, the processing capacity of an electron beam facility depended on the processing rate, which was influenced by the beam power and efficiency of its use. The cost of starch electron beam processing depended on the indirect (variable) operating costs and the desired absorbed dose, thus depending on the beam power, the efficiency of its use and the conversion factor of the beam power from the facility consumption power. Our calculation showed that EB processing with an average absorbed dose of 30 kGy increased the price of the native starch by approximately 16%.
ACKNOWLEDGEMENTS
We are grateful to Dr. Adrian Dinescu for the help in recording SEM images of the samples.
This research was partially supported by project PN II 51-007/2007.
REFERENCES
Abu, J. O., Duodu, K. G. and Minaar, A., Effect of γ-irradiation on some physicochemical and thermal properties of cowpea (Vigna Unguiculata L. Walp) starch. Food Chemistry, 95, 386 (2006). [ Links ]
Baszczak, W., Fornal, J., Amarowicz, R. and Pegg, R. B., Lipids of wheat, corn and potato starch. Journal of Food Lipids, 10, 301 (2003). [ Links ]
Cael, J. J., Koenig, J. L. and Blackwell, J., Infrared and Raman spectroscopy of carbohydrates. Part IV: Normal coordinate analysis of V-amylose. Biopolymers, 14, 1885 (1975). [ Links ]
Chung, H. J. and Liu, Q., Effect of gamma irradiation on molecular structure and physicochemical properties of corn starch. Journal of Food Science, 74, C353 (2009). [ Links ]
Chung, H. J. and Liu, Q., Molecular structure and physicochemical properties of potato and bean starches as affected by gamma-irradiation. International Journal of Biological Macromolecules, 47, 214 (2010). [ Links ]
Cleland, M. R. and Parks, L. A., Medium and high-energy electron beam radiation processing equipment for commercial applications. Nuclear Instruments and Methods in Physics Research Section B: Beam Interactions with Materials and Atoms, 208, 74 (2003). [ Links ]
Directive 1999/2/EC of the European Parliament and of the Council of 22 February 1999 on the Approximation of the Laws of the Member States Concerning Foods and Food Ingredients Treated with Ionising Radiation. Official Journal of the European Communities L 66/16 (1999). [ Links ]
Duarte, P. R. and Rupnow, J. H., Gamma-irradiated dry bean (Phaseoulus Vulgaris) starch: Physicochemical properties. Journal of Food Science, 59, 839 (1994). [ Links ]
Ershov, B. G., Radiation-chemical degradation of cellulose and other polysaccharides. Russian Chemical Reviews, 67, 315 (1998). [ Links ]
Gani, A., Bashir, M., Wani, S. M. and Masoodi, F. A., Modification of bean starch by γ-irradiation: Effect on functional and morphological properties. LWT - Food Science and Technology, 49, 162 (2012). [ Links ]
Kamal, H., Sabry, G. M., Lotfy, S., Abdallah, N. M., Ulanski, P., Rosiak, J. and Hegazy, E.-S.A., Controlling of degradation effects in radiation processing of starch. Journal of Macromolecular Science, Part A: Pure and Applied Chemistry, 44, 865 (2007). [ Links ]
Kitahara, K., Suganuma, T. and Nagahama, T., Bound free fatty acids in glucoamylase-digested starches of corn and sweetpotato. Cereal Chemistry, 71, 439 (1994). [ Links ]
Kizil, J. and Seetharaman, K., Characterization of irradiated starches by using FT-Raman and FTIR spectroscopy. Journal of Agricultural and Food Chemistry, 50, 3912 (2002). [ Links ]
Korenev, S., Critical analysis of industrial electron accelerators. Radiation Physics and Chemistry, 71, 535 (2004). [ Links ]
Lee, Y. J., Kim, S. Y., Lim, S. T., Han, S. M., Kim, H. M. and Kang, I. J., Physicochemical properties of gamma-irradiated corn starch. Journal of Food Science and Nutrition, 11, 146 (2006). [ Links ]
Liu, T., Ma, Y., Xue, S. and Shi, J., Modifications of structure and physicochemical properties of maize starch by γ-irradiation treatments. LWT - Food Science and Technology, 46, 156 (2012). [ Links ]
Liu, Y., Himmelsbach, D. S. and Barton, F. E., Two-dimensional Fourier transform Raman correlation spectroscopy determination of the glycosidic linkages in amylose and amylopectin. Applied Spectroscopy, 58, 745 (2004). [ Links ]
Mischnick, P., Structure, chemistry, analysis and physiological aspects of starch and modified starches. Proceedings of Euro Food Chem XIII, vol. 1, 7 (2005). [ Links ]
Morrison, R. M., An economic analysis of electron accelerators and cobalt-60 for irradiating food. Technical Bulletin no. 1762, United States Department of Agriculture, Economic Research Service (1989). [ Links ]
Morrison, W. R., Lipids in cereal starches: A review. Journal of Cereal Science, 8, 1 (1988). [ Links ]
Nemţanu, M. R., Minea, R., Kahraman, K., Koksel, H., Ng, P. K. W., Popescu, M. I. and Mitru, E., Electron beam technology for modifying the functional properties of maize starch. Nuclear Instruments and Methods in Physics Research, Section A: Accelerators, Spectrometers, Detectors and Associated Equipment, 580, 795 (2007). [ Links ]
Nemţanu, M. R. and Braşoveanu, M., Aspects regarding the rheological behavior of wheat starch treated with accelerated electron beam. Romanian Journal of Physics, 55, 111 (2010). [ Links ]
Nemţanu, M. R., Brasoveanu, M. and Iovu, H., Degradation rate of some electron beam irradiated starches. Scientific Bulletin University Politehnica of Bucharest, Series B: Chemistry and Materials Science, 72, 69 (2010). [ Links ]
Nemţanu, M. R. and Braşoveanu, M., Functional properties of some non-conventional treated starches. In: Biopolymers, (Edited by M. Eknashar), p. 319, Scyio, Rijeka, Croatia (2010). [ Links ]
Pimpa, B., Muhammad, S. K. S., Hassan, M. A., Ghazali, Z., Hashim, K. and Kanjanasopa, D., Effect of electron beam irradiation on physicochemical properties of sago starch. Songklanakarin Journal of Science and Technology, 29, 759 (2007). [ Links ]
Sevenou, O., Hill, S. E., Farhat, I. A. and Mitchell, J. R., Organisation of the external region of the starch granule as determined by infrared spectroscopy. International Journal of Biological Macromolecules, 31, 79 (2002). [ Links ]
Shishonok, M. V., Litvyak, V. V., Murshko, E. A., Grinyuk, E. V., Sal'nikov, L. I., Roginets, L. P. and Krul', L. P., Structure and properties of electron beam irradiated potato starch. High Energy Chemistry, 41, 425 (2007). [ Links ]
Soest, J. J. G. van, Tournois, H., Wit, D. De and Vliegenthart, J. F. G., Short-range structure in (partially) crystalline potato starch determined with attenuated total reflectance Fourier-transform IR spectroscopy. Carbohydrate Research, 279, 201 (1995). [ Links ]
SR EN ISO 20483:2007 - Cereals and legumes. Determination of Nitrogen Content and Calculation of Crude Protein Content - Kjeldahl Method. (In Romanian). [ Links ]
SR 90:2007 - Wheat Flour. Analyses Methods (In Romanian). [ Links ]
Stewart, E. M., Food Irradiation Chemistry. In: Food Irradiation: Principles and Applications. Molins, R. (Ed.), John Wiley & Sons, Inc., New York (2001). [ Links ]
Teodorescu, I. E. and Fiti, M., Iradierea Tehnologică. Editura Academiei RSR, Bucureşti (1979). (In Romanian). [ Links ]
Tester, R. F., Karkalas, J. and Qi, X., Starch - composition, fine structure and architecture. Journal Cereal Sciences, 39, 151 (2004). [ Links ]
Vasco, P. D., Blackwell, J. and Koenig, J. L., Infrared and Raman spectroscopy of carbohydrates. Part II: Normal coordinate analysis of α-D-glucose. Carbohydrate Research, 23, 407 (1972). [ Links ]
World Health Organization (WHO), High-Dose Irradiation: Wholesomeness of Food Irradiated with Dose above 10 kGy: Report of a Joint FAO/ IAEA/WHO Study Group. Technical Report Series 890, Geneva, Switzerland (1999). [ Links ]
(Submitted: August 2, 2012 ; Revised: October 29, 2012 ; Accepted: November 7, 2012)
For further details log on website :
http://www.scielo.br/scielo.php?script=sci_arttext&pid=S0104-66322013000400016


 (1)
(1)
 (2)
(2) (3)
(3)