1
IDL, Departamento de Engenharia Geográfica, Geofísica e Energia, Faculdade de Ciências, Universidade de Lisboa, 1749-016 Lisboa, Portugal
2
LEAF, Departamento de Ciências e Engenharia de Biossistemas, Instituto Superior de Agronomia, Universidade de Lisboa, 1349-017 Lisboa, Portugal
3
Departamento de Geologia, Faculdade de Ciências, Universidade Agostinho Neto, 1231 Luanda, Angola
4
NOVA IMS, Information Management School, Universidade Nova de Lisboa, 1070-312 Lisboa, Portugal
5
ITC, Department of Water Resources, Faculty of Geo-information Science and Earth Observation, University of Twente, P.O. Box 6, 7500 AA Enschede, The Netherlands
*
Author to whom correspondence should be addressed.
Academic Editors: Zhongbo Su, Yijian Zeng, Clement Atzberger and Prasad S. Thenkabail
Received: 31 March 2016 / Revised: 3 June 2016 / Accepted: 14 June 2016 / Published: 22 June 2016
(This article belongs to the Special Issue Land Surface Processes and Interactions—From HCMM to Sentinel Missions and beyond)
Abstract
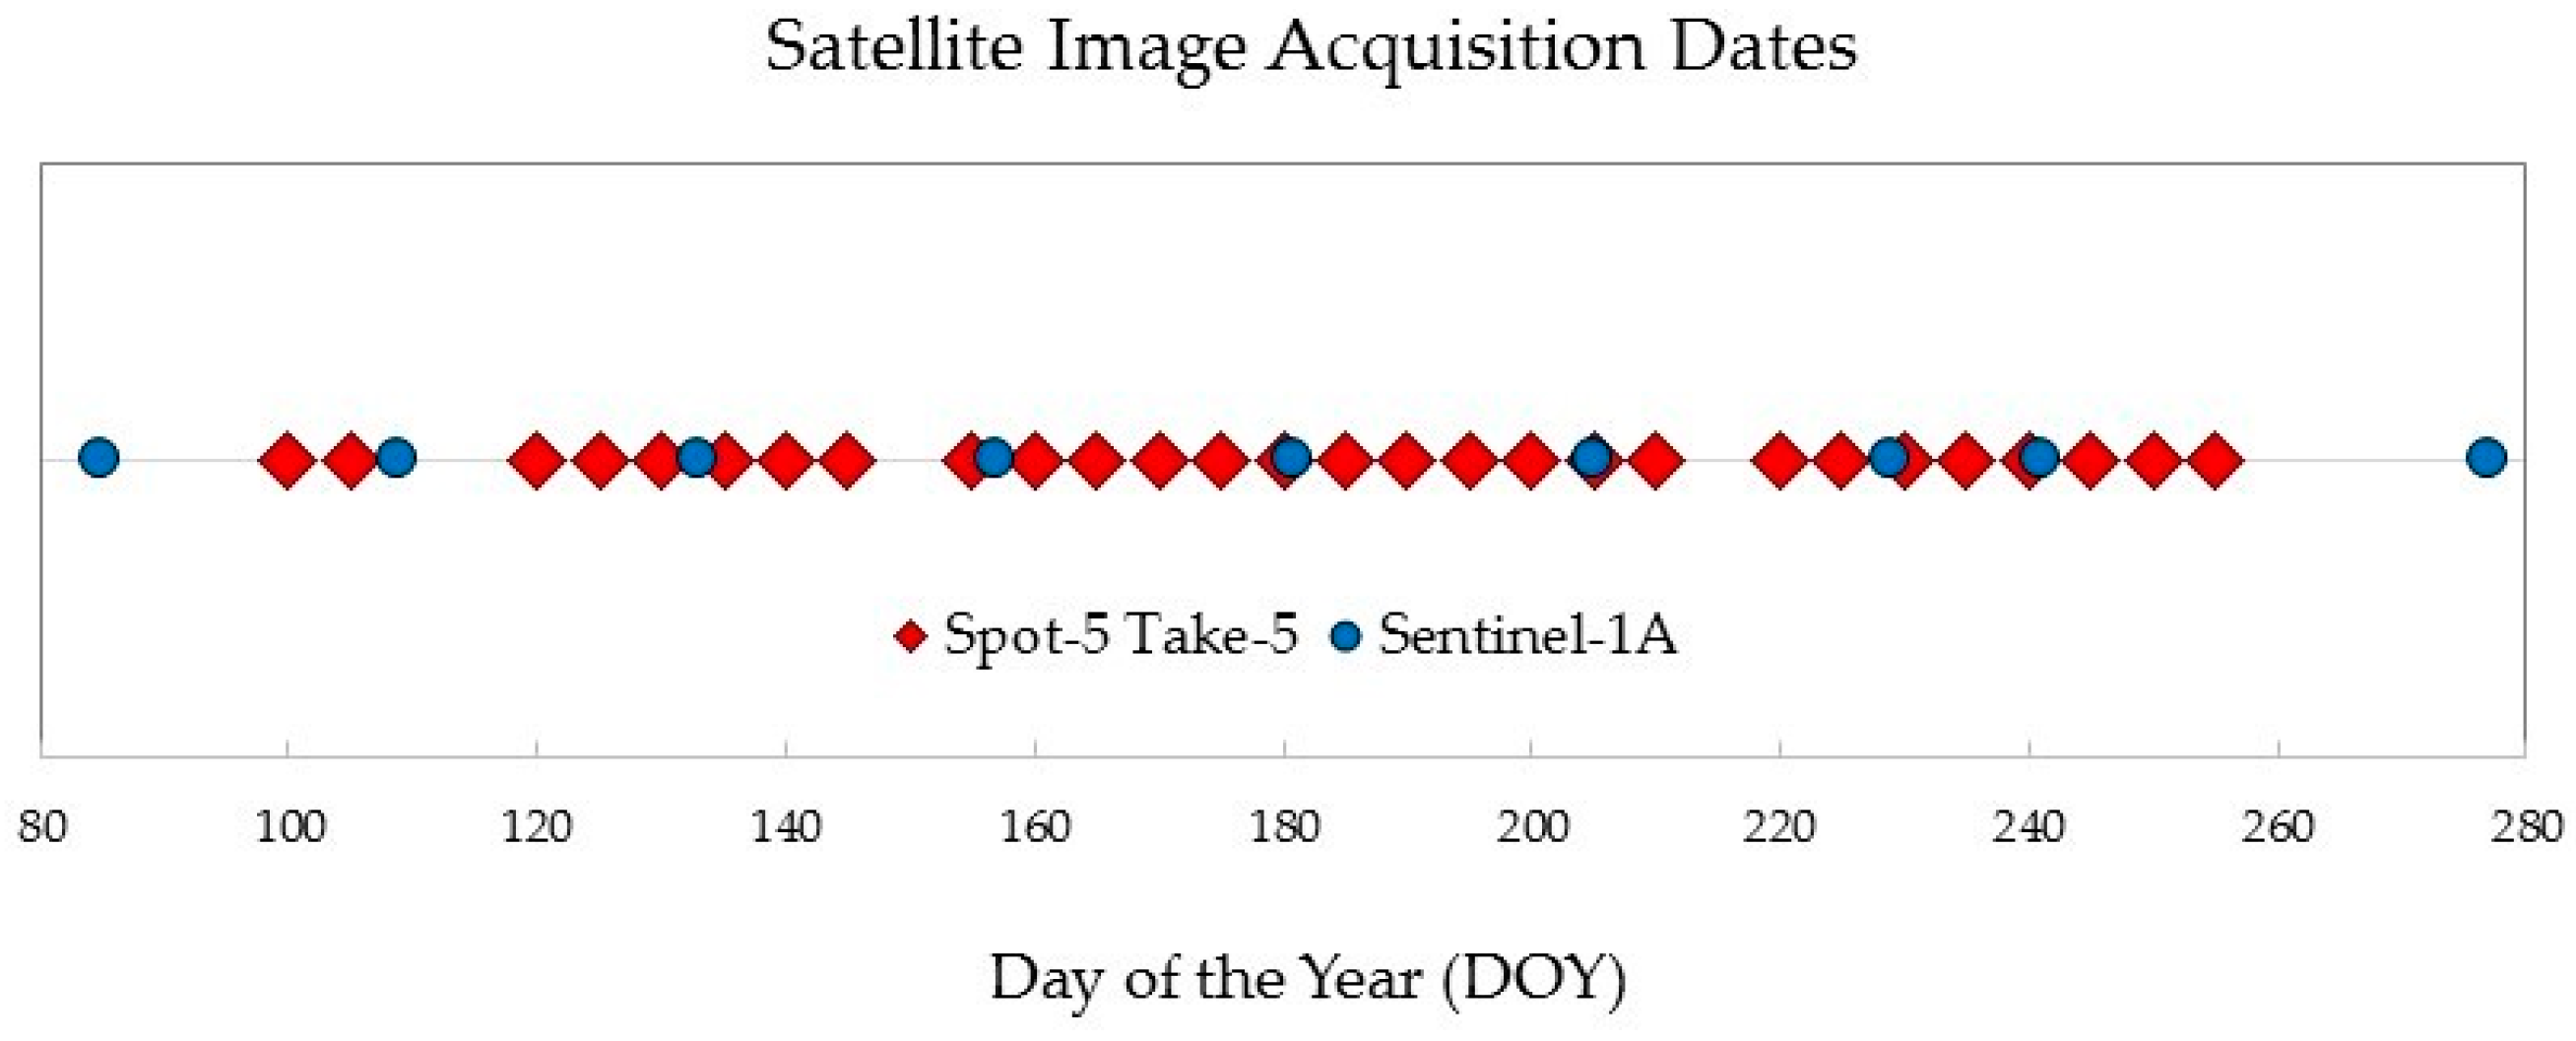
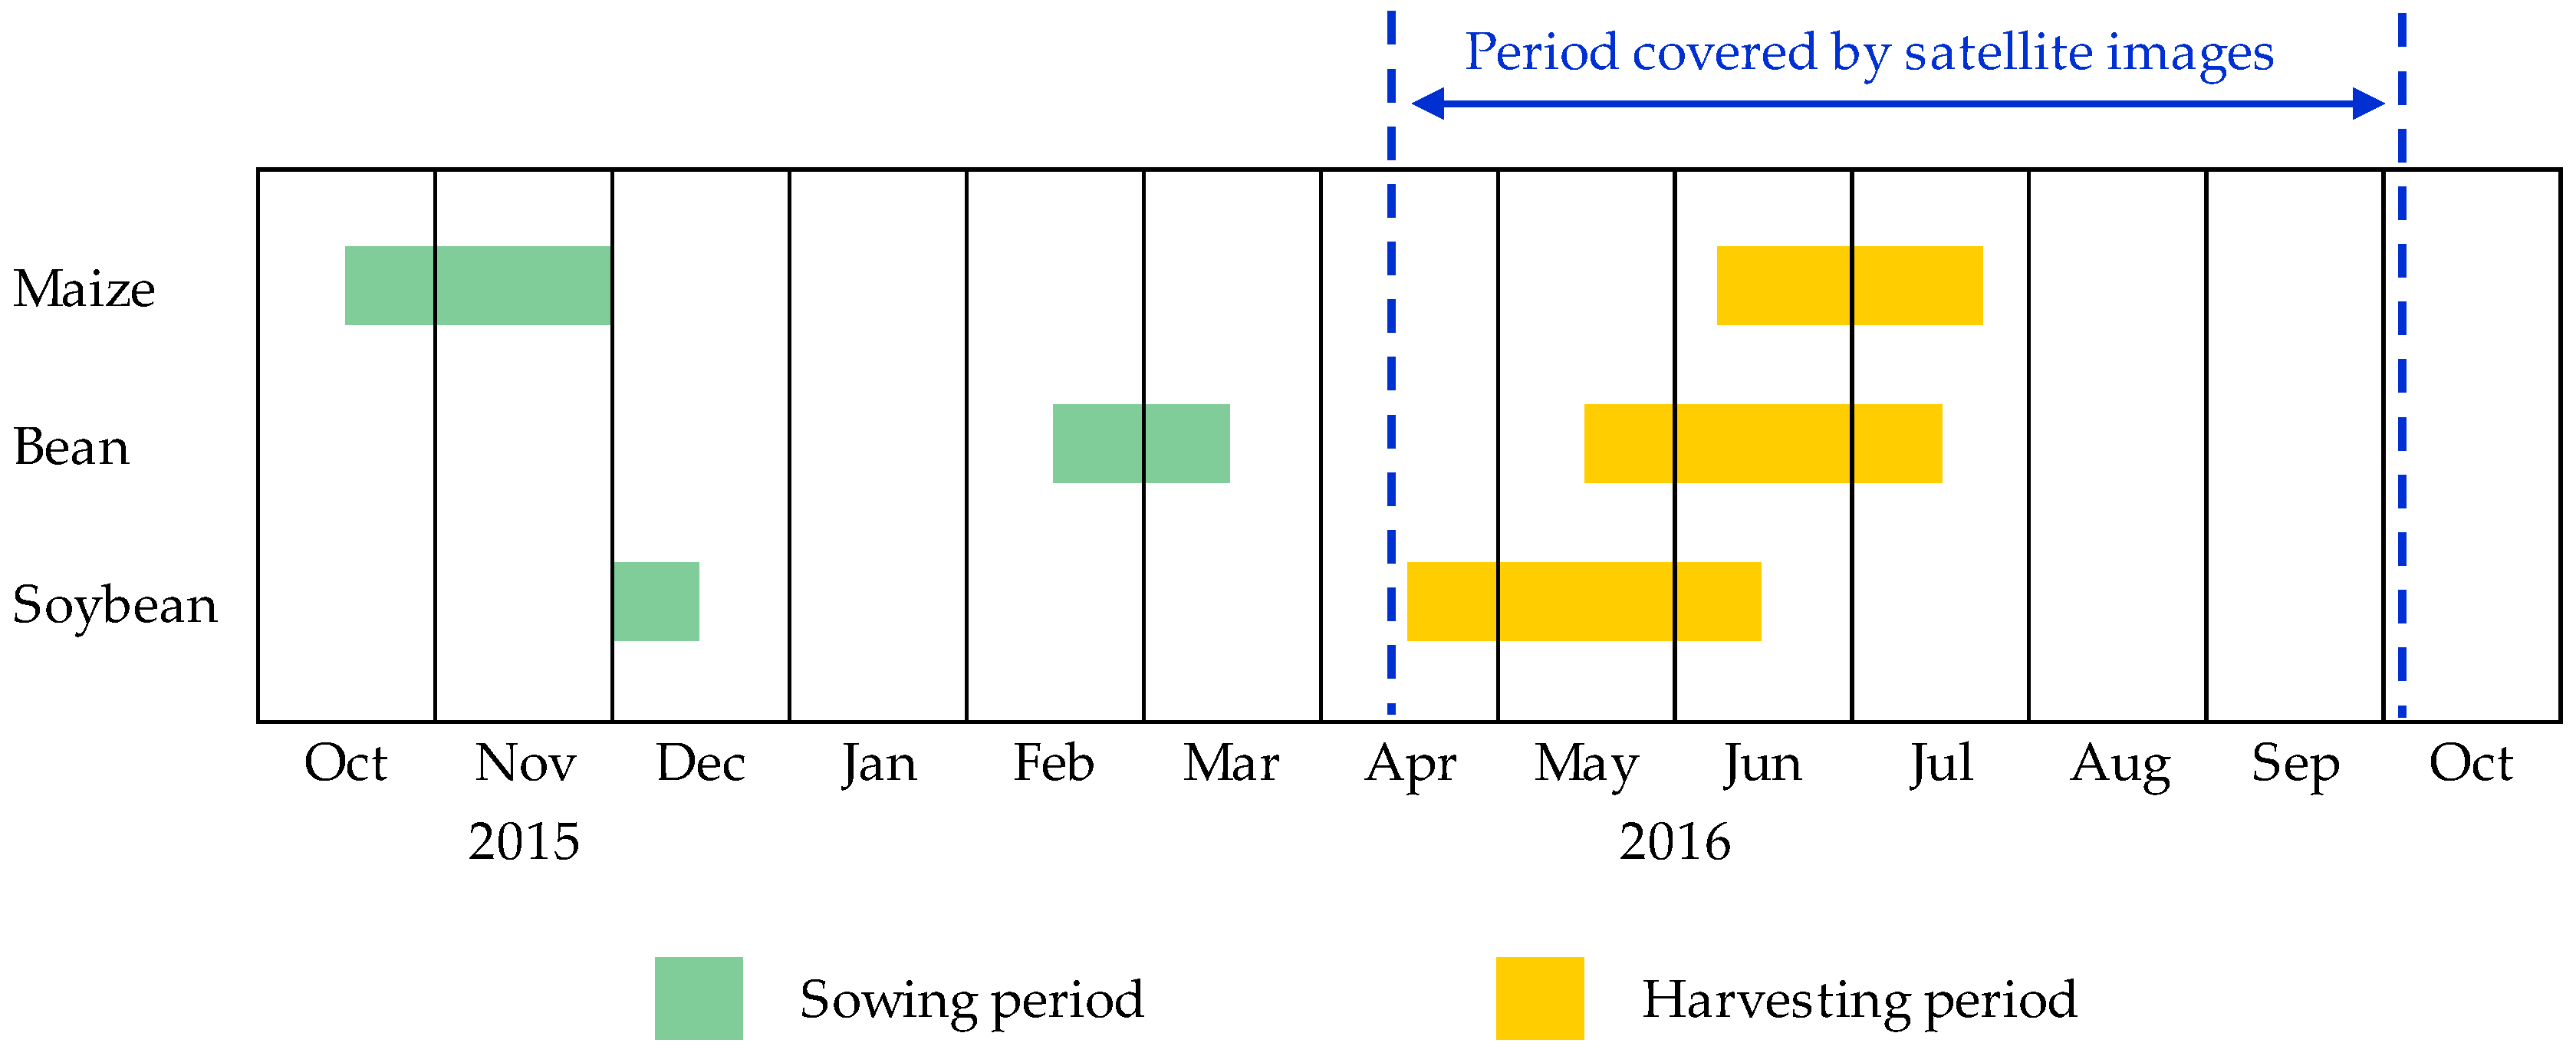
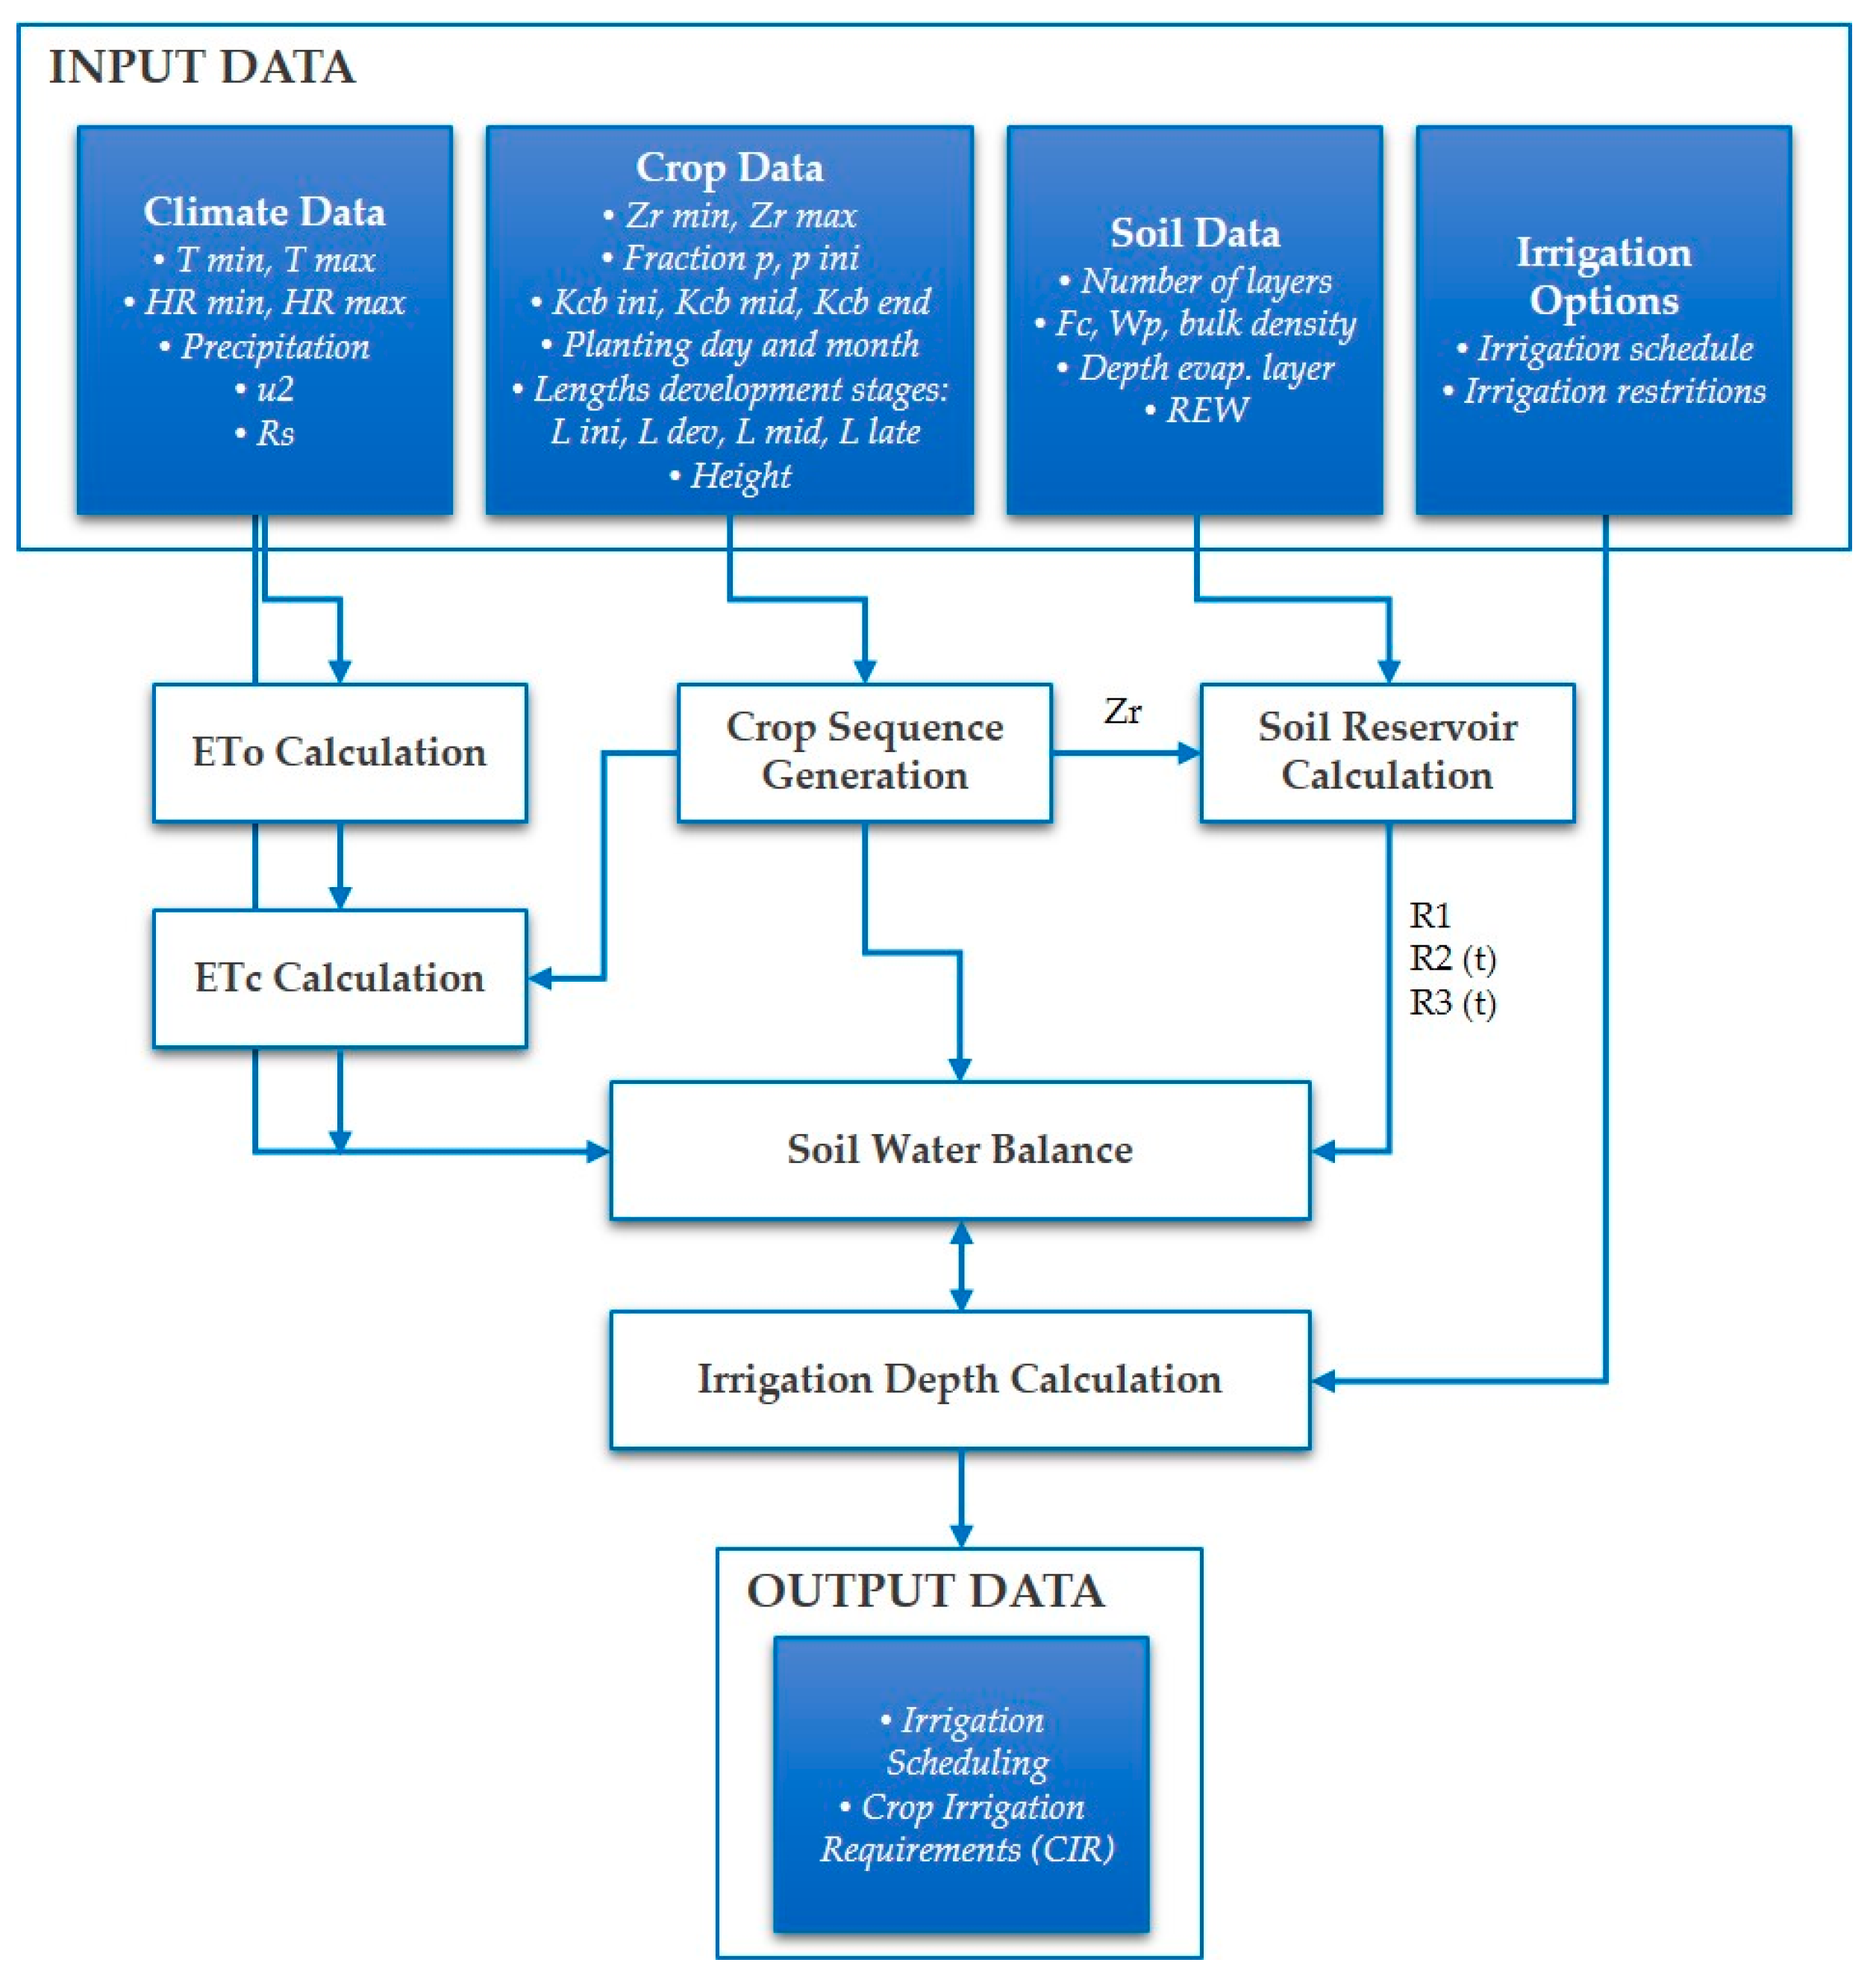
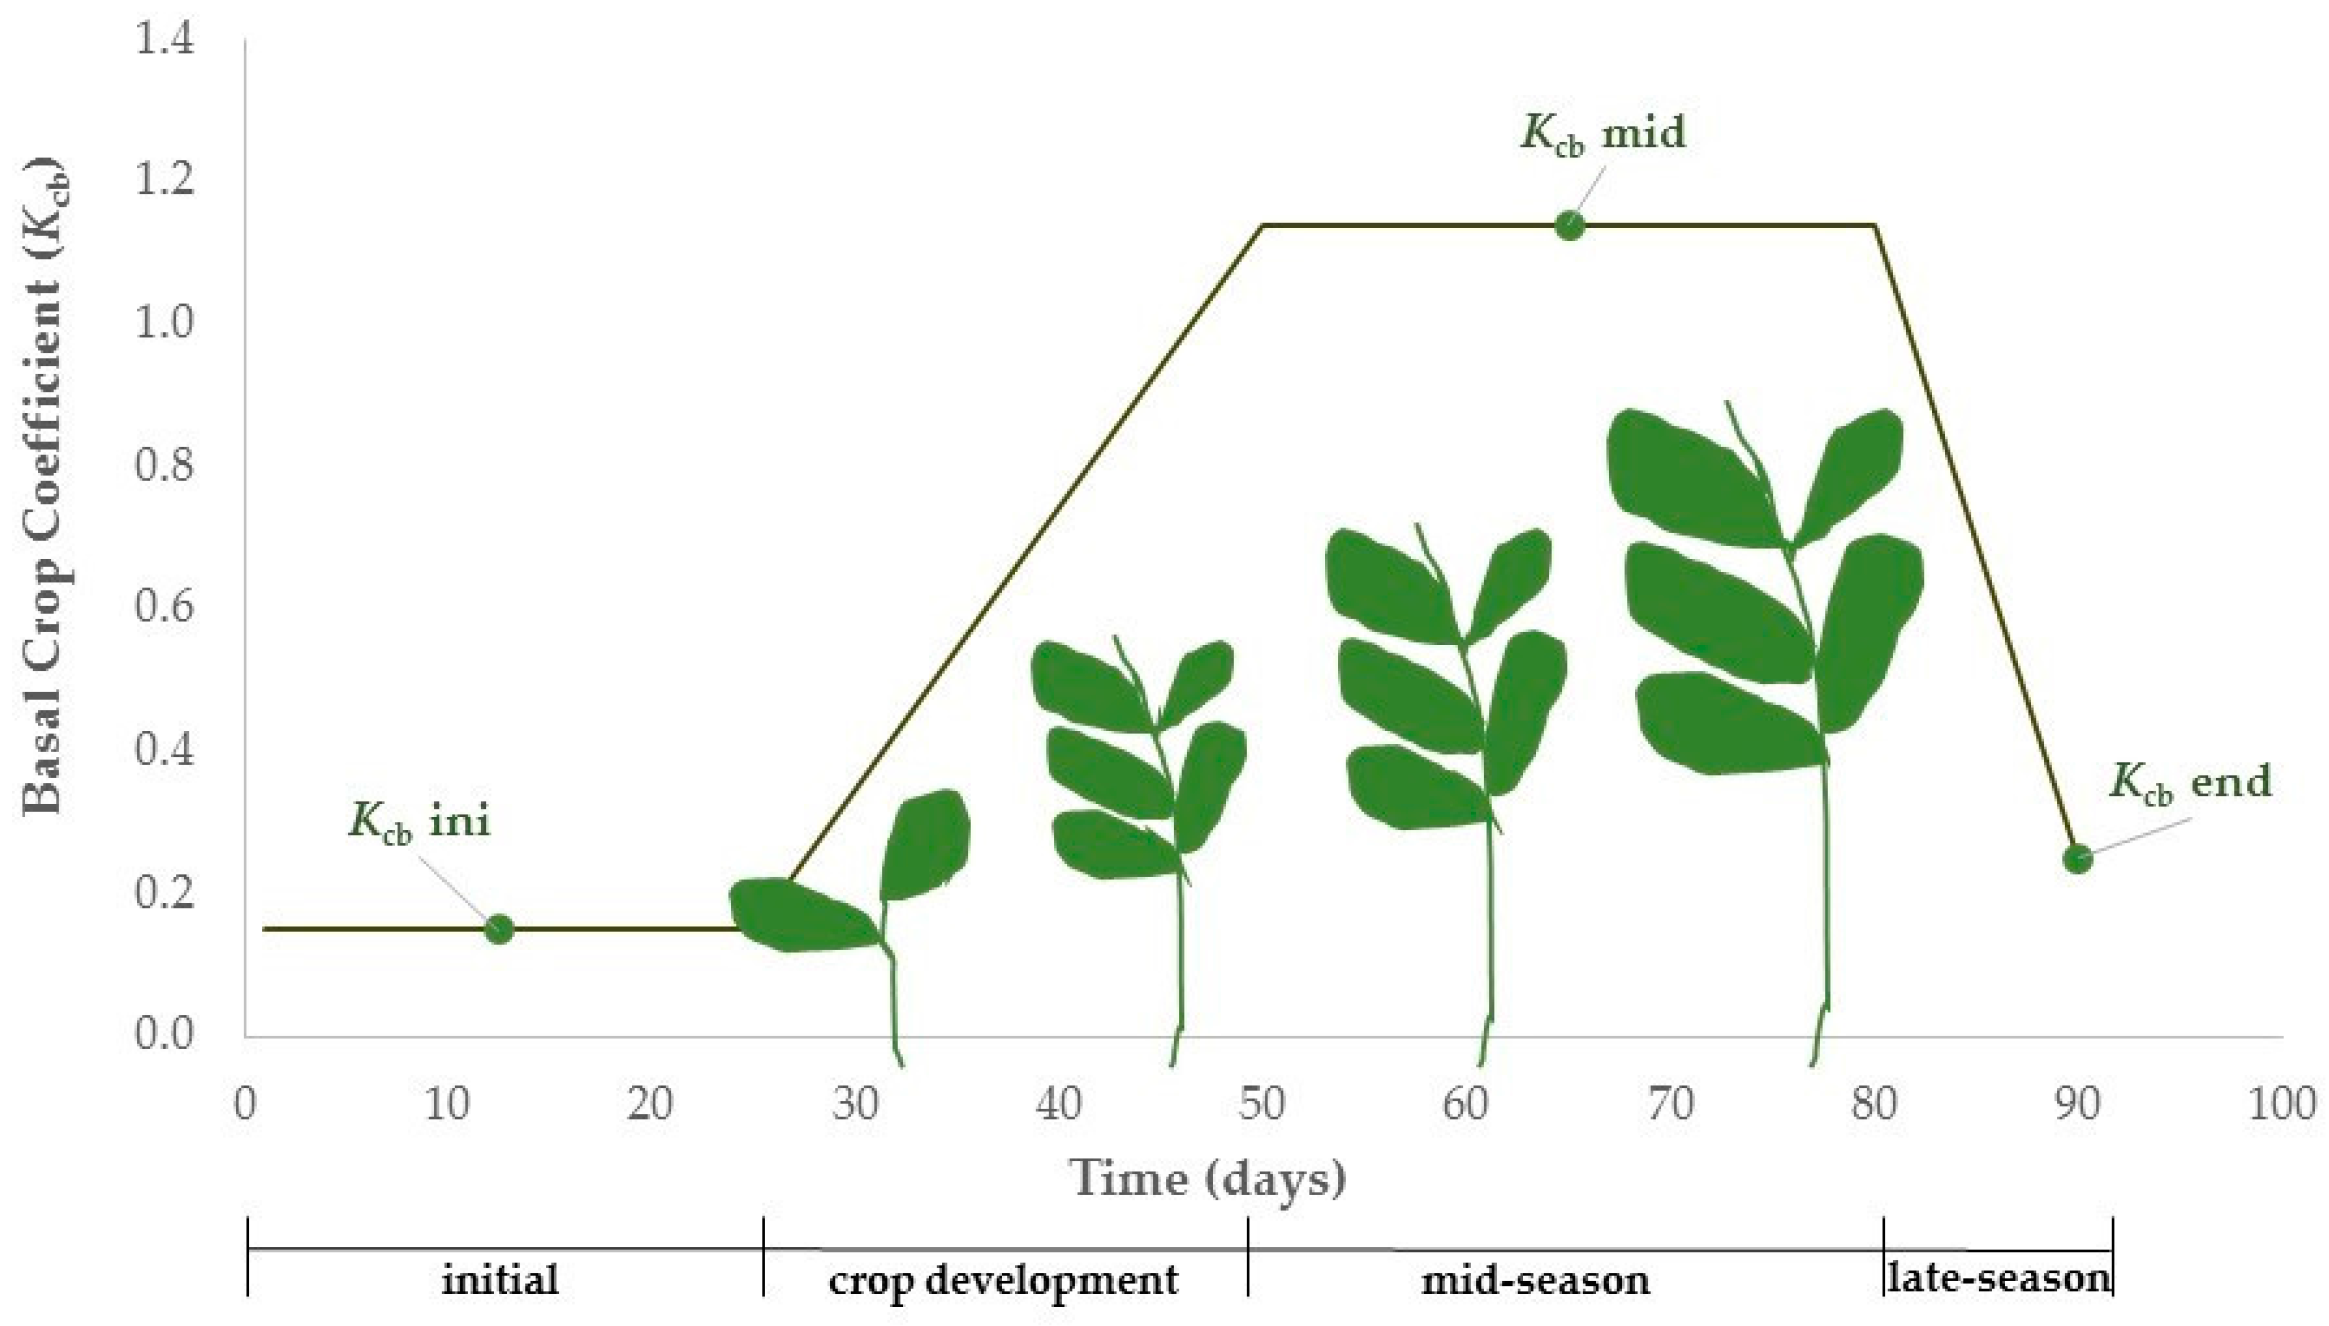
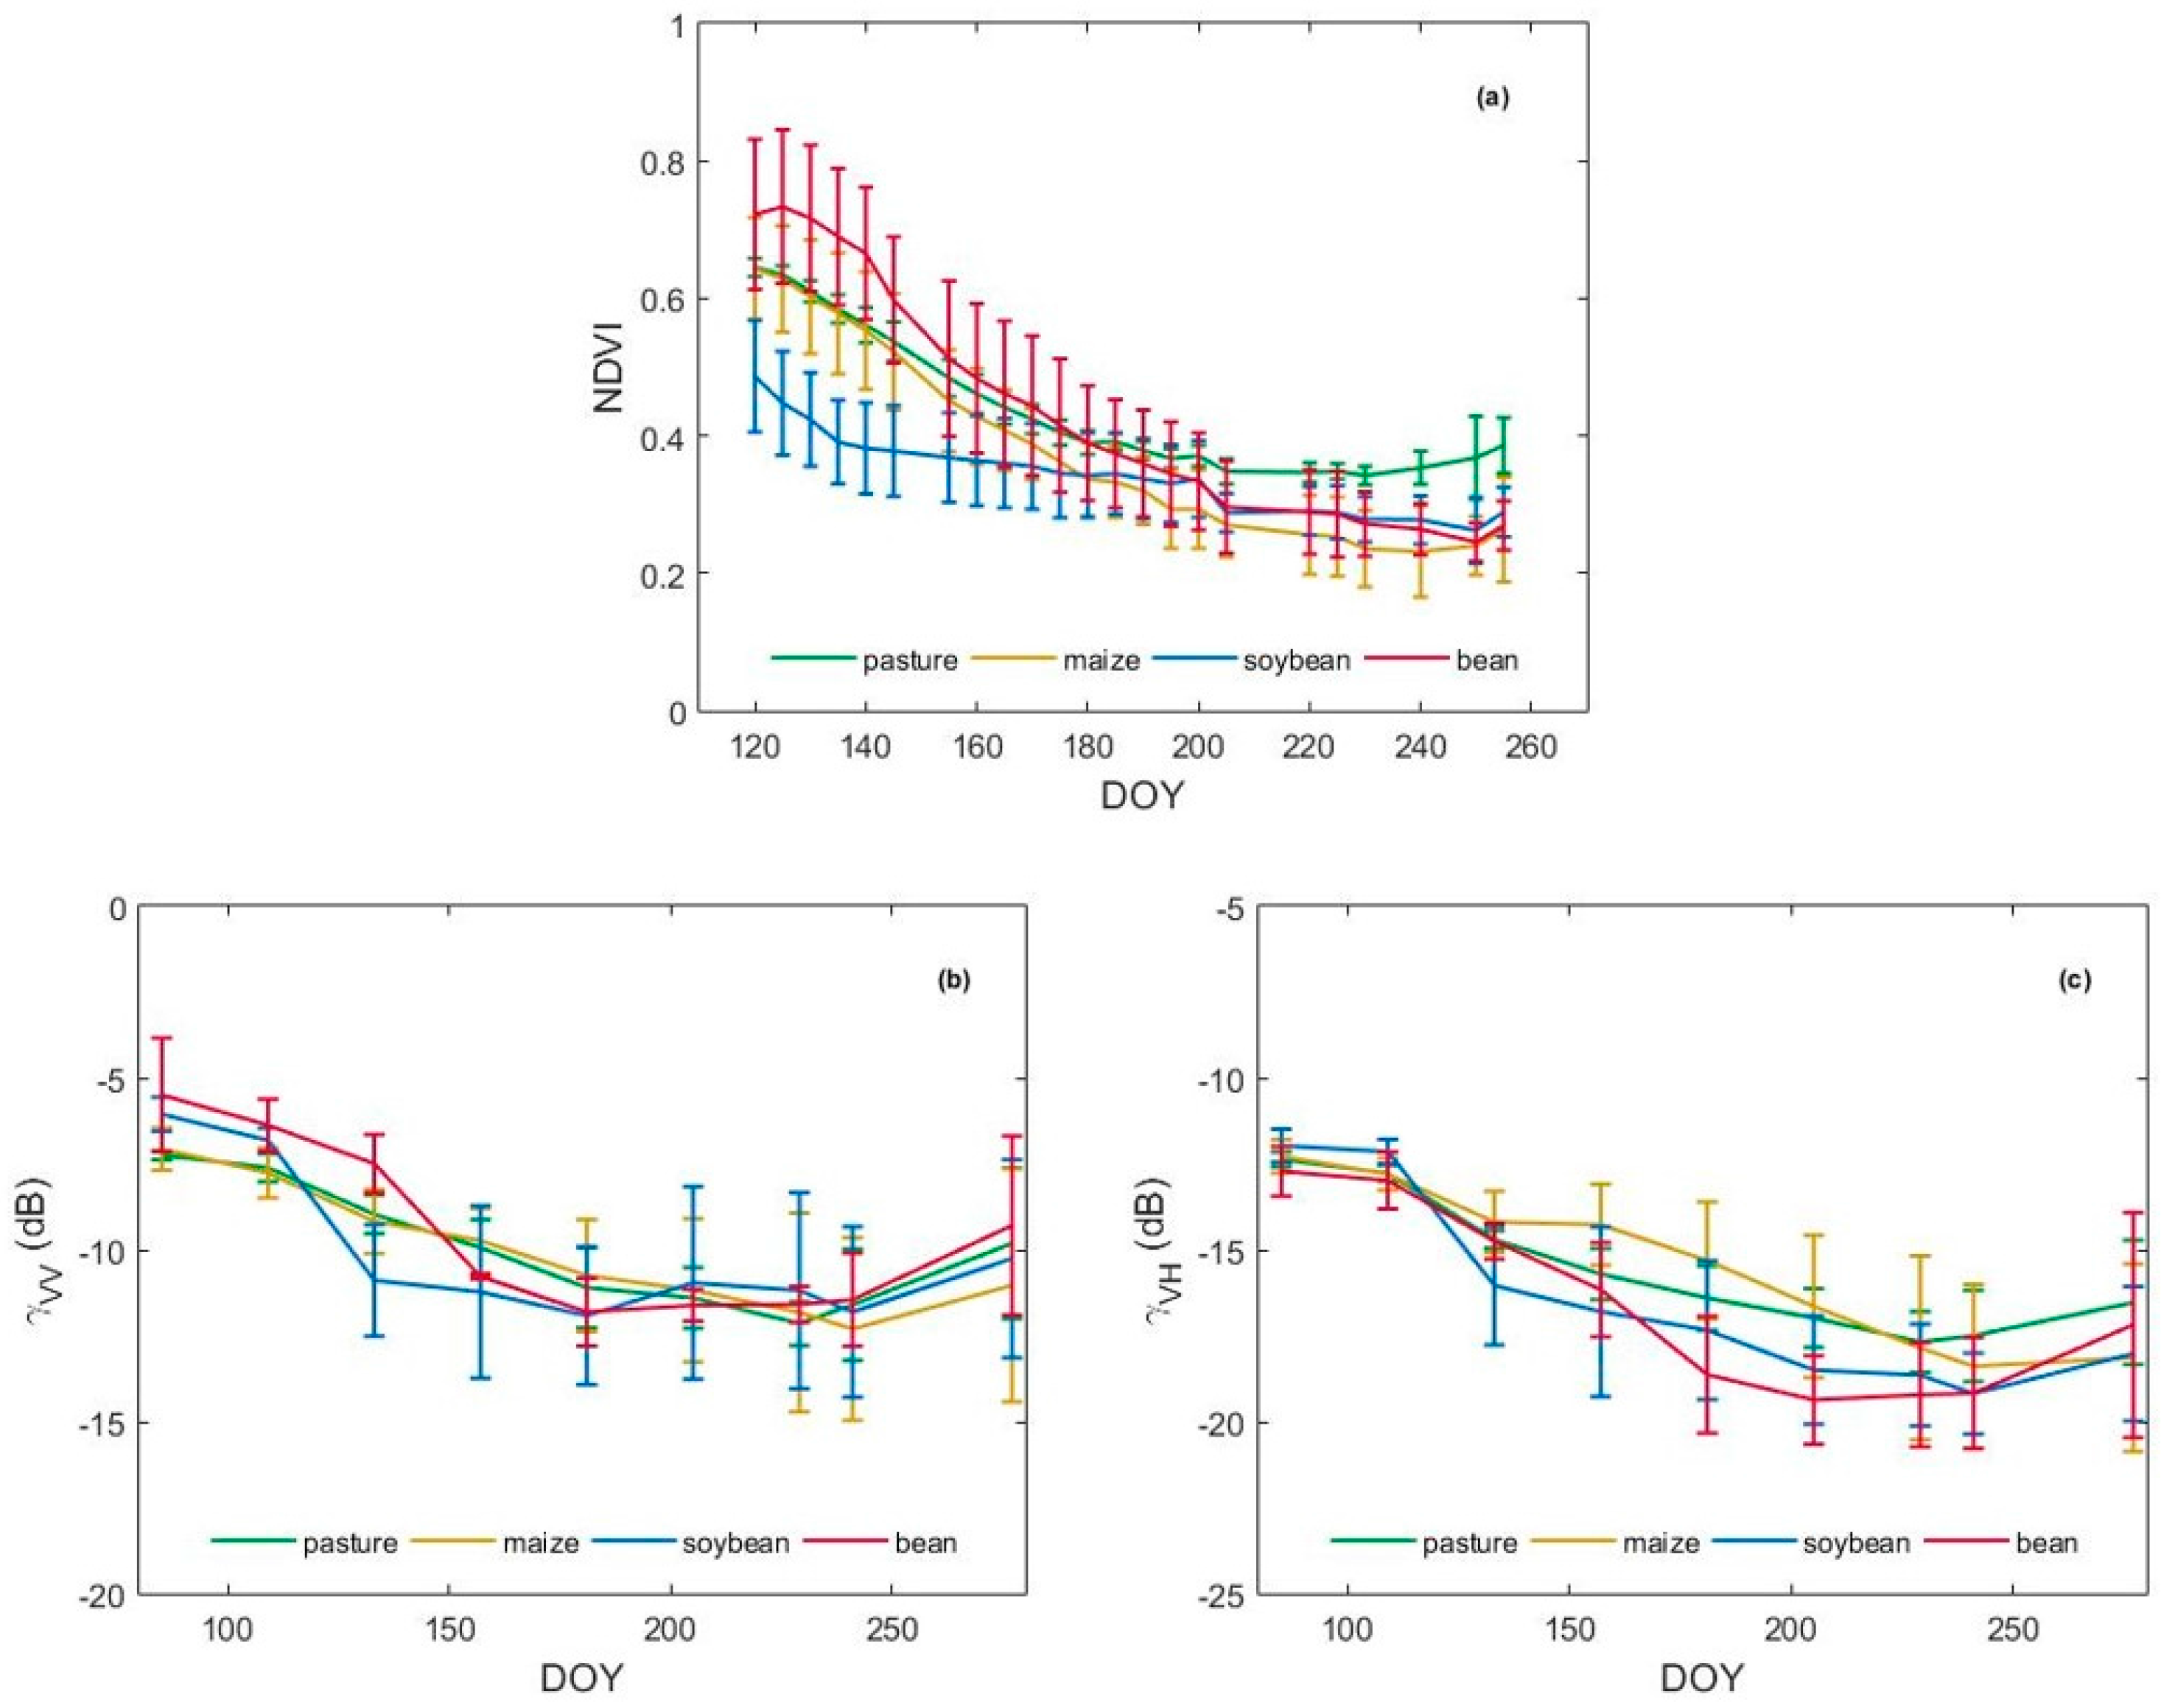
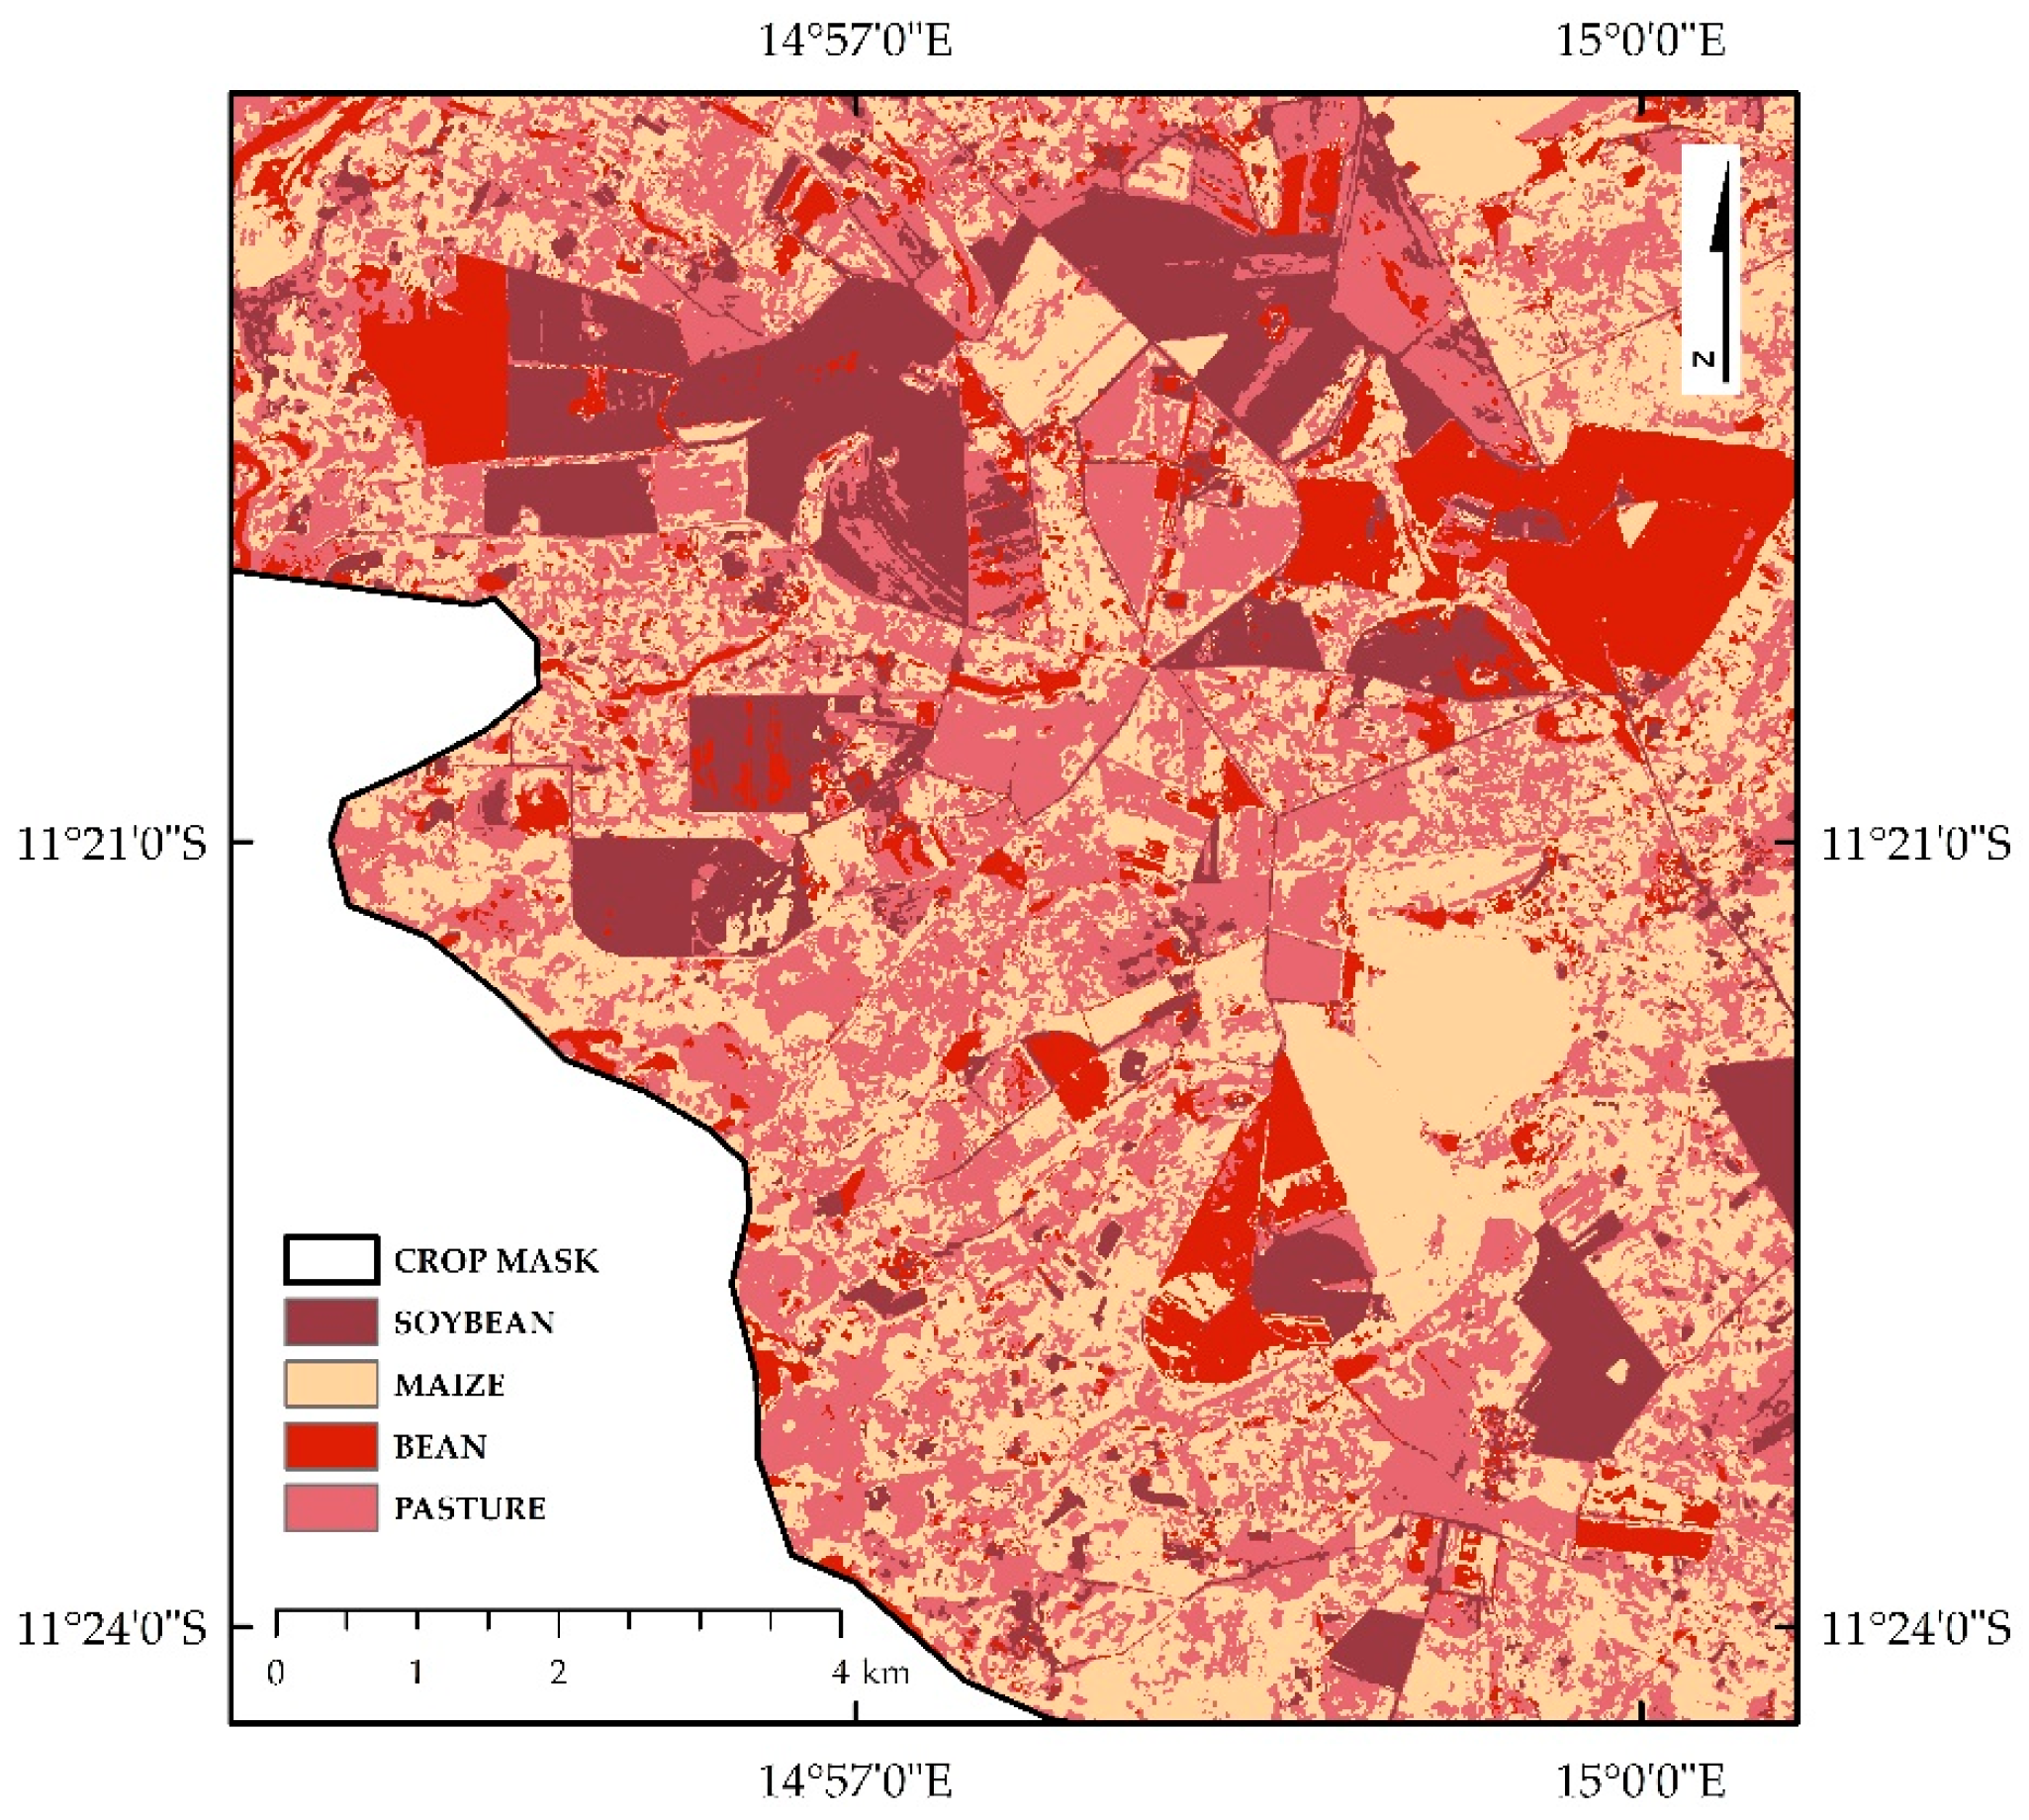
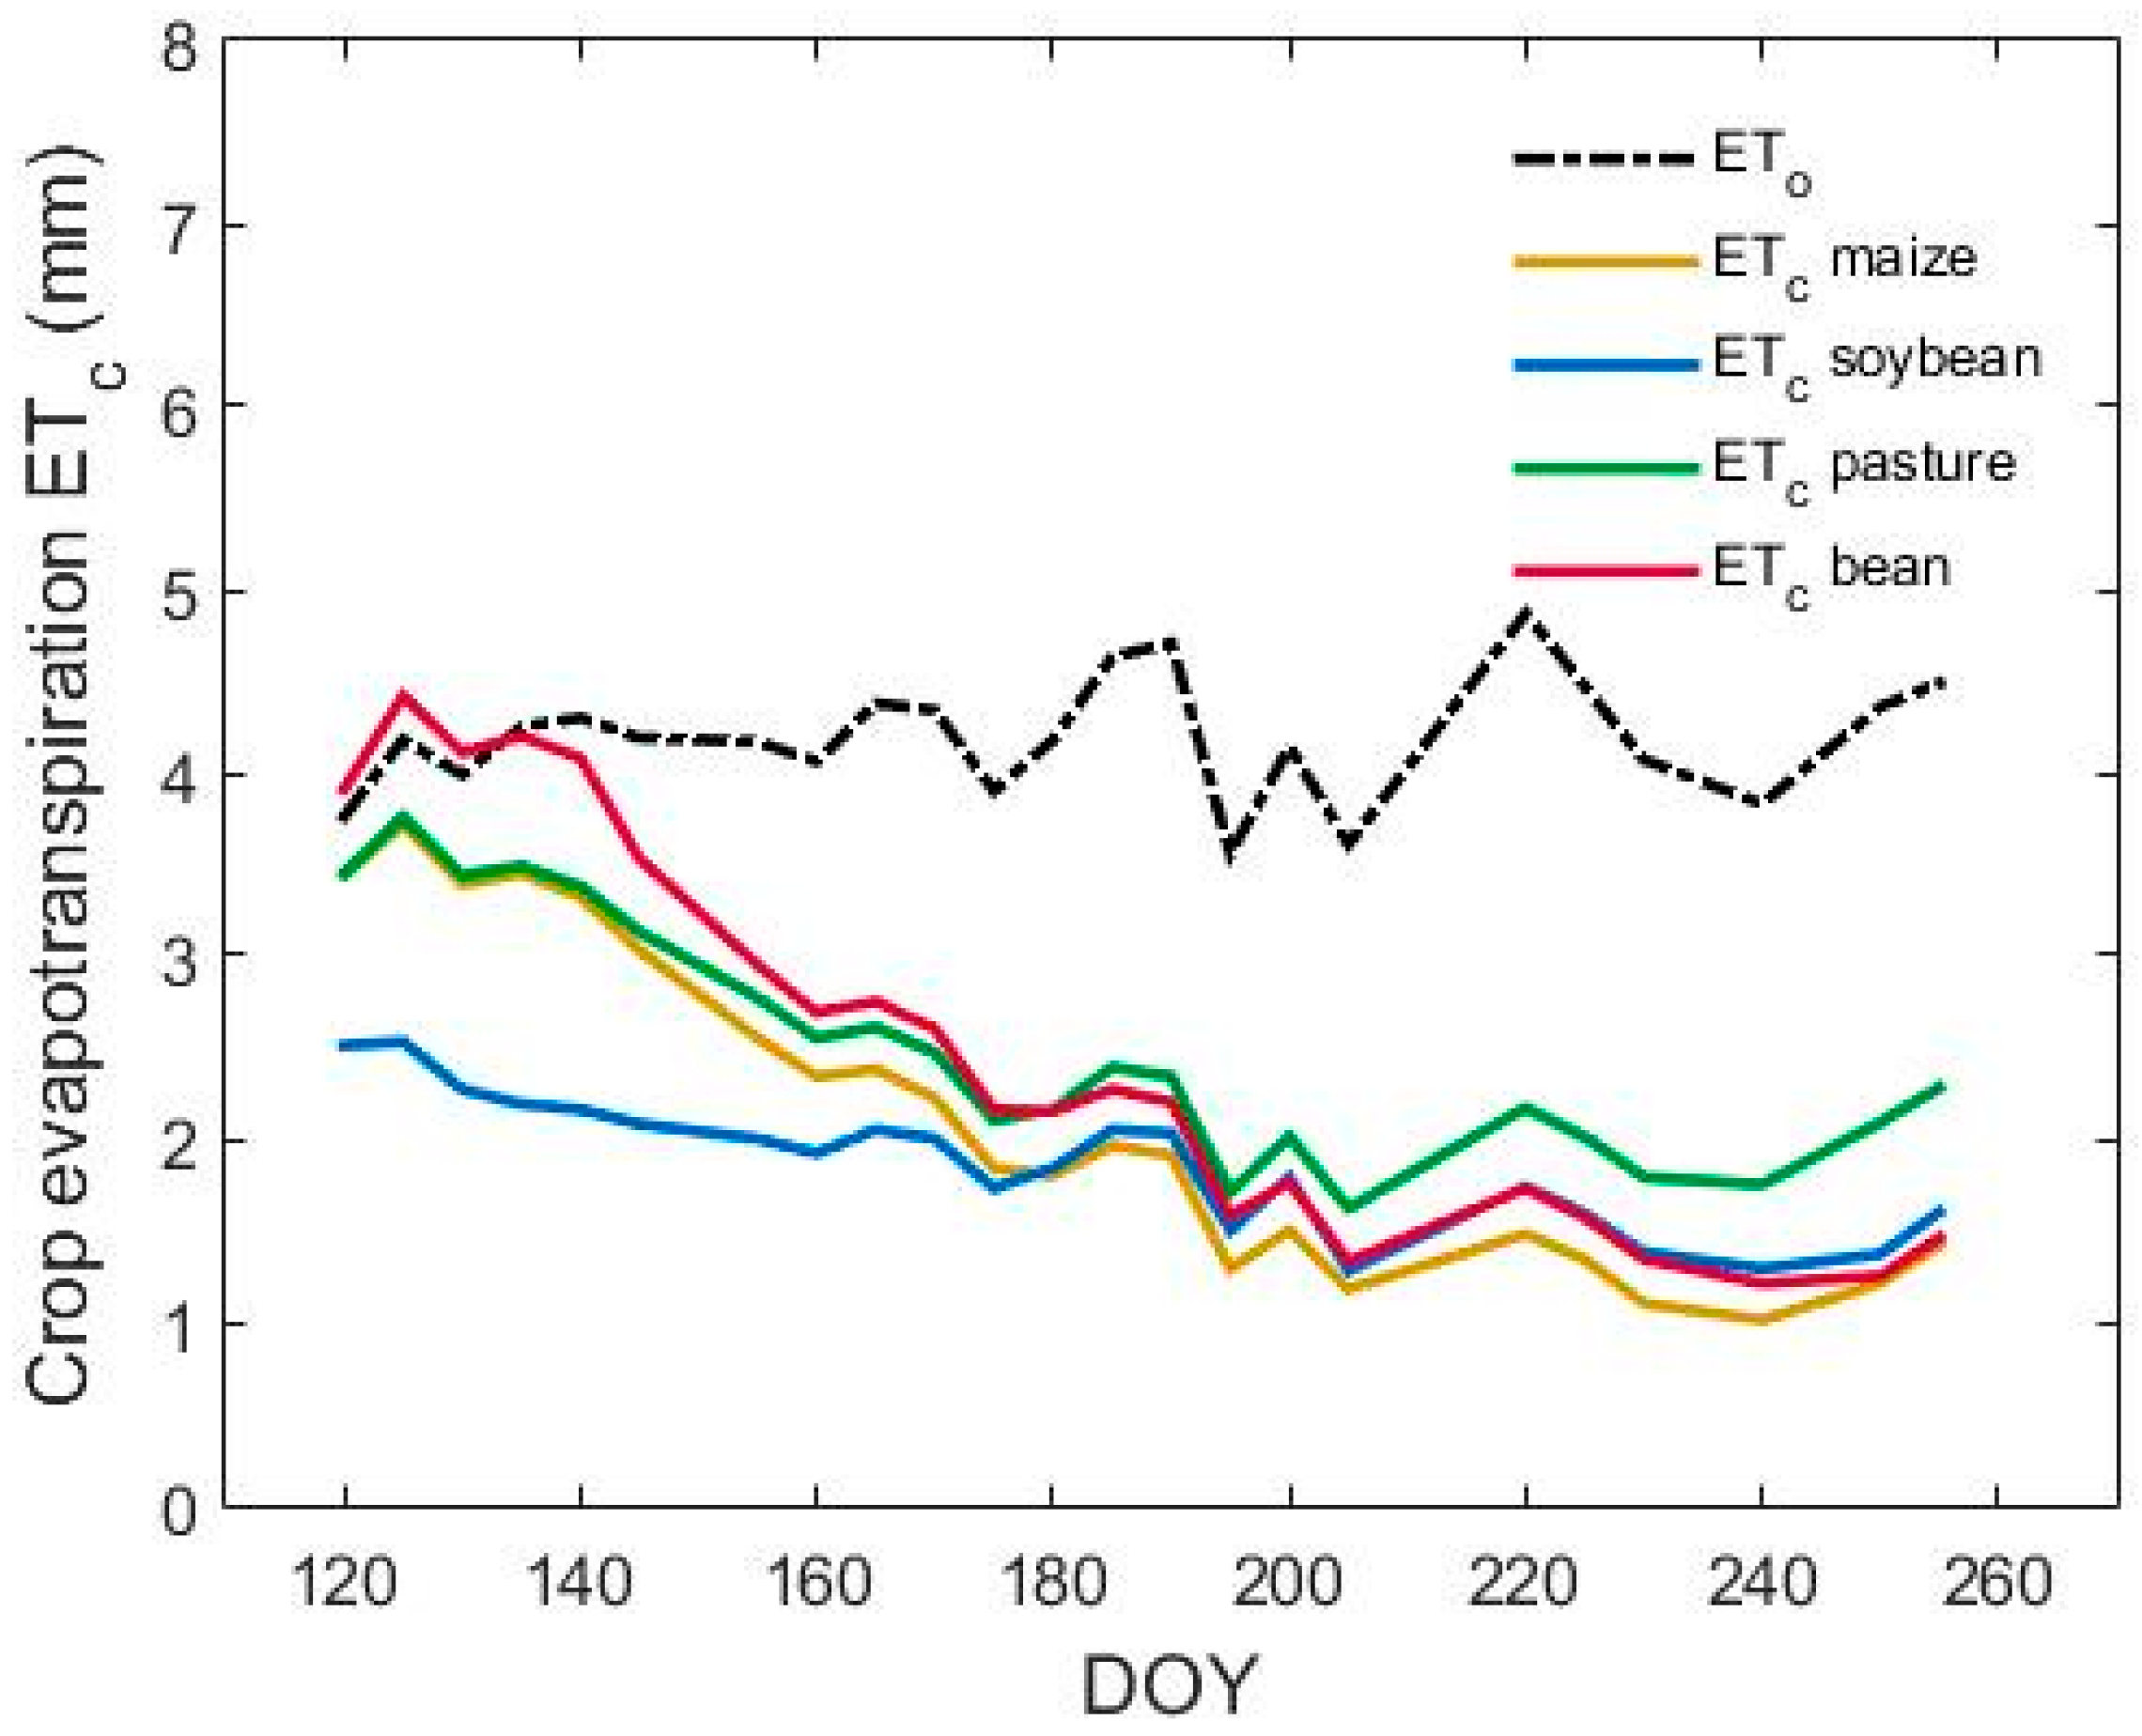
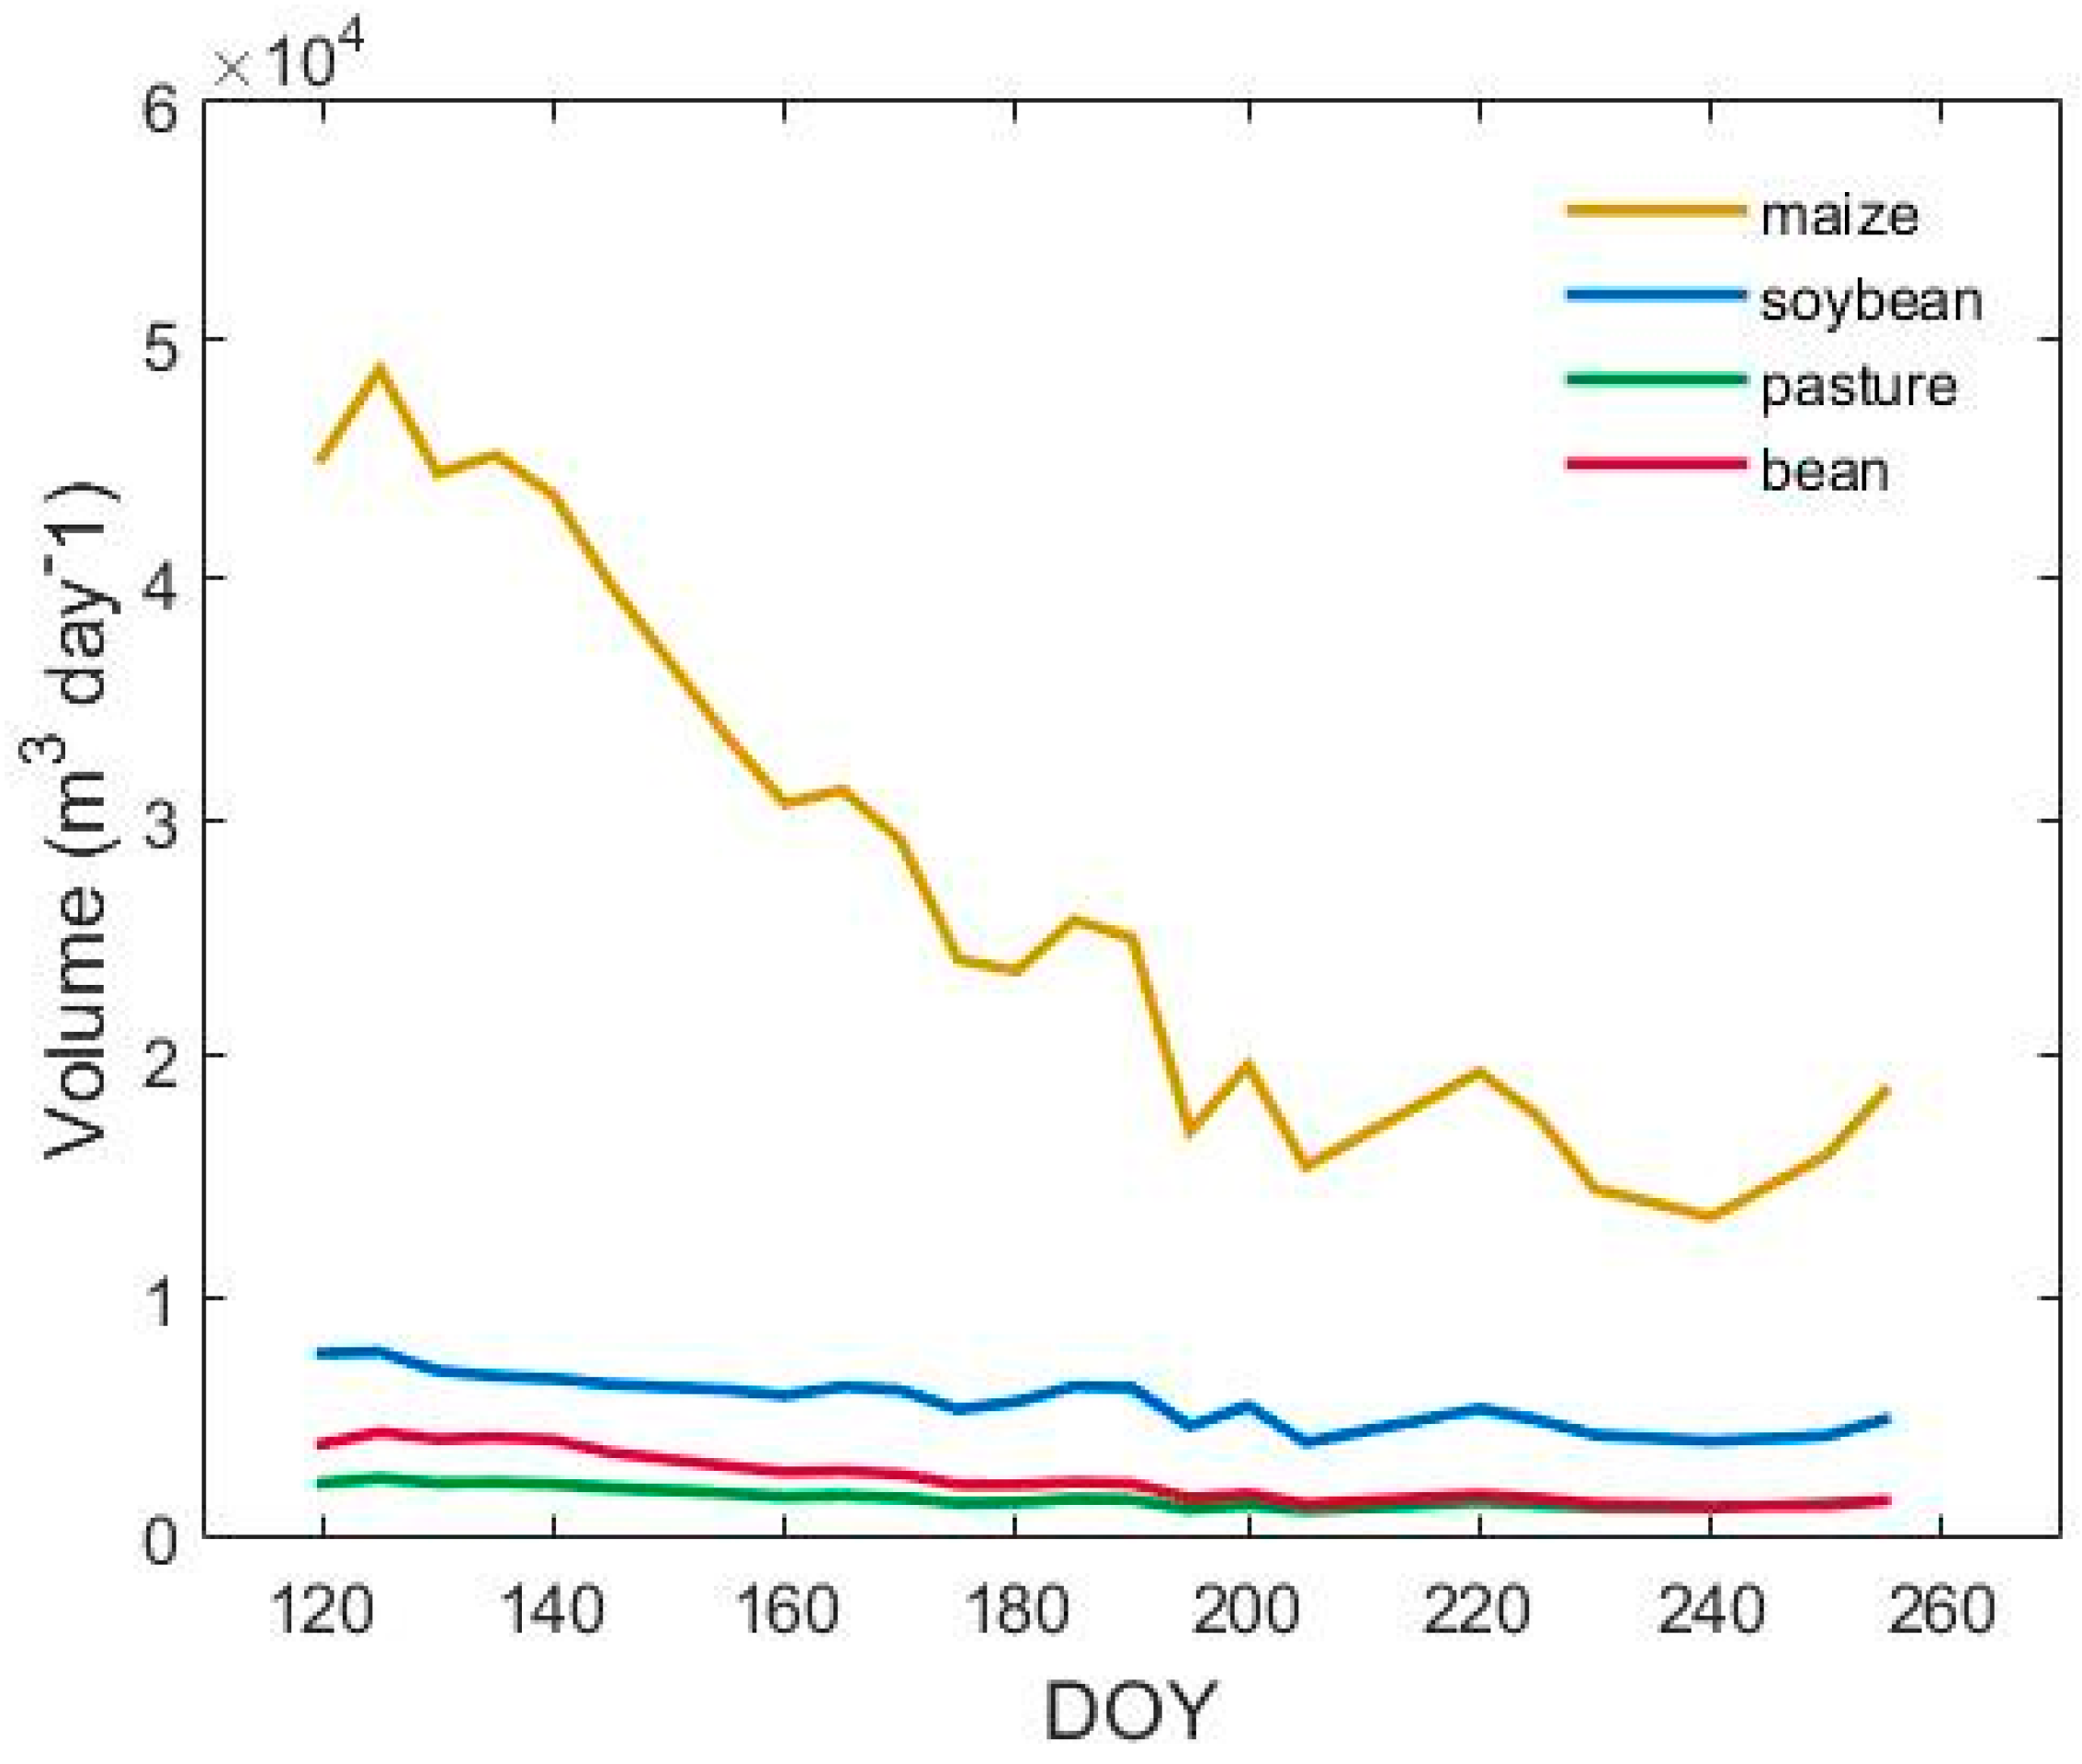
Optical and microwave images have been combined for land cover monitoring in different agriculture scenarios, providing useful information on qualitative and quantitative land cover changes. This study aims to assess the complementarity and interoperability of optical (SPOT-5 Take-5) and synthetic aperture radar (SAR) (Sentinel-1A) data for crop parameter (basal crop coefficient (Kcb) values and the length of the crop’s development stages) retrieval and crop type classification, with a focus on crop water requirements, for an irrigation perimeter in Angola. SPOT-5 Take-5 images are used as a proxy of Sentinel-2 data to evaluate the potential of their enhanced temporal resolution for agricultural applications. In situ data are also used to complement the Earth Observation (EO) data. The Normalized Difference Vegetation Index (NDVI) and dual (VV + VH) polarization backscattering time series are used to compute the Kcb curve for four crop types (maize, soybean, bean and pasture) and to estimate the length of each phenological growth stage. The Kcb values are then used to compute the crop’s evapotranspiration and to subsequently estimate the crop irrigation requirements based on a soil water balance model. A significant R2 correlation between NDVI and backscatter time series was observed for all crops, demonstrating that optical data can be replaced by microwave data in the presence of cloud cover. However, it was not possible to properly identify each stage of the crop cycle due to the lack of EO data for the complete growing season. View Full-Text
Keywords: agriculture; land cover change; SPOT-5 Take-5; Sentinel-1A; evapotranspiration; TIGER initiative
▼ Figures
This is an open access article distributed under the Creative Commons Attribution License which permits unrestricted use, distribution, and reproduction in any medium, provided the original work is properly cited. (CC BY 4.0).
For further details log on website :
http://www.mdpi.com/2072-4292/8/6/525?utm_source=TrendMD&utm_medium=cpc&utm_campaign=Remote_Sens_TrendMD_0


No comments:
Post a Comment