1
Centre for Climate Science and Policy Research, Department of Thematic Studies/Environmental Change, Linköping University, Linköping 581 83, Sweden
2
Centre for Environment and Sustainability (GMV), University of Gothenburg and Chalmers University of Technology, Gothenburg 405 30, Sweden
3
Section of Forest Remote Sensing, Department of Forest Resource Management, Swedish University of Agricultural Sciences, Umeå 901 83, Sweden
4
Institut de l'Environnement et de Recherches Agricoles (INERA), Département Productions Forestières, 03 BP 7047 Ouagadougou 03, Burkina Faso
5
Polytechnic University of Bobo-Dioulasso, Development Rural Institute/Department of Forestery, BP 01 1091 Bobo-Dioulasso, Burkina Faso
6
Division of Physical Resource Theory, Department of Energy and Environment, Chalmers University of Technology, Gothenburg 412 96, Sweden
*
Author to whom correspondence should be addressed.
Academic Editors: Josef Kellndorfer and Prasad S. Thenkabail
Received: 8 June 2015 / Revised: 24 July 2015 / Accepted: 29 July 2015 / Published: 6 August 2015
Abstract
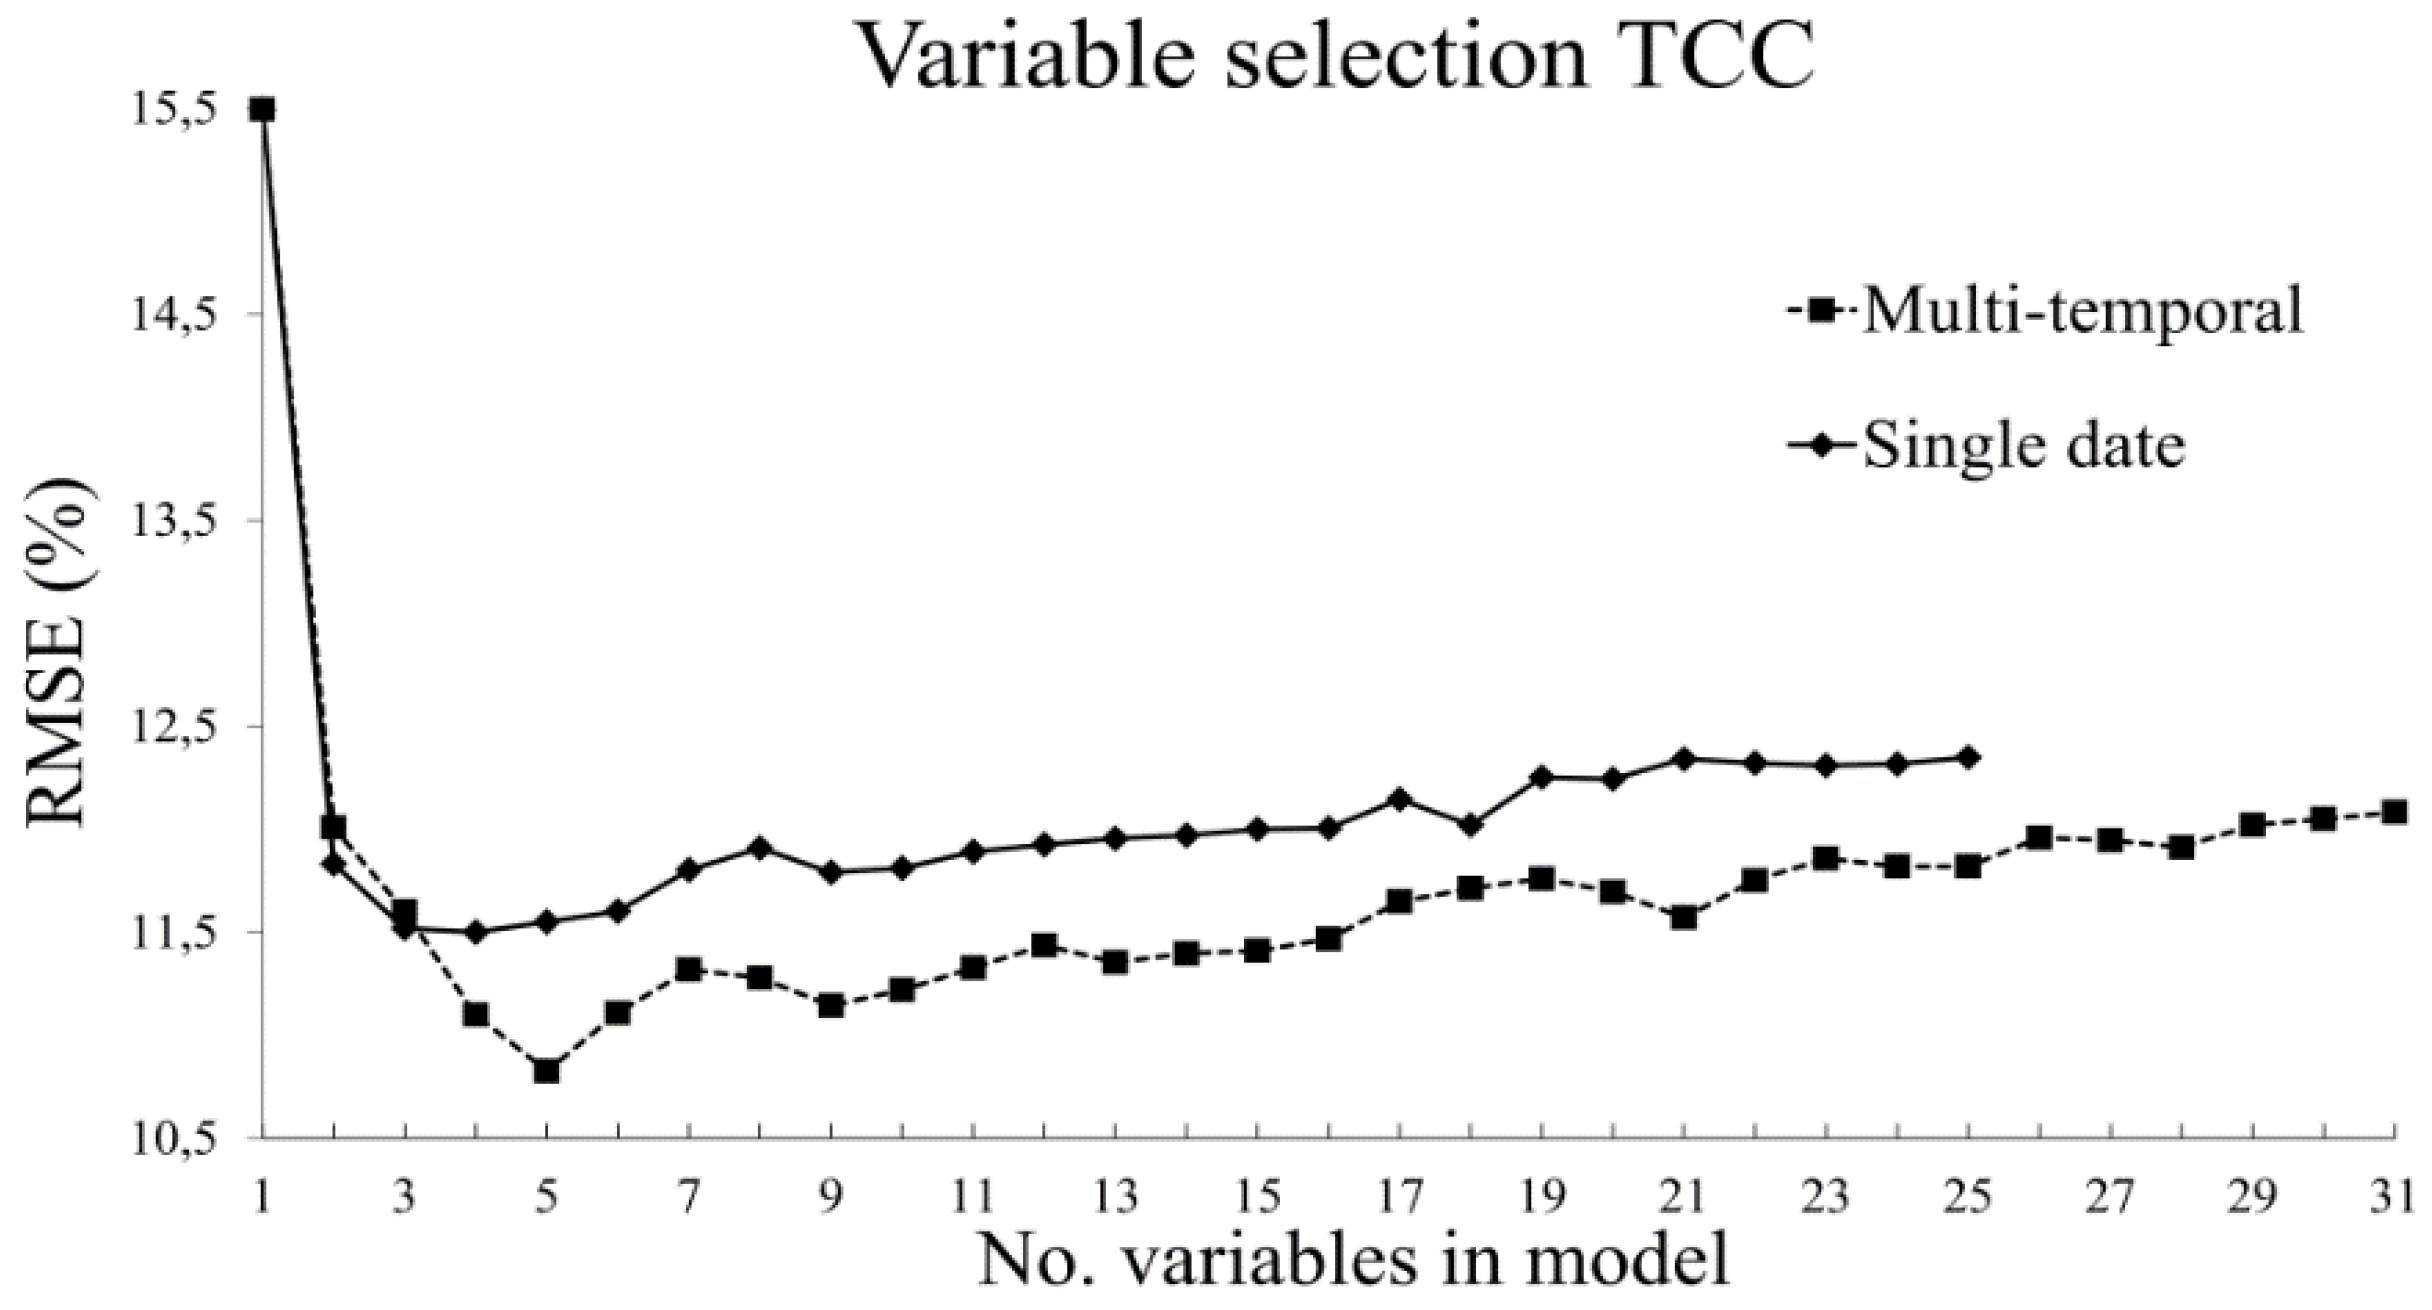
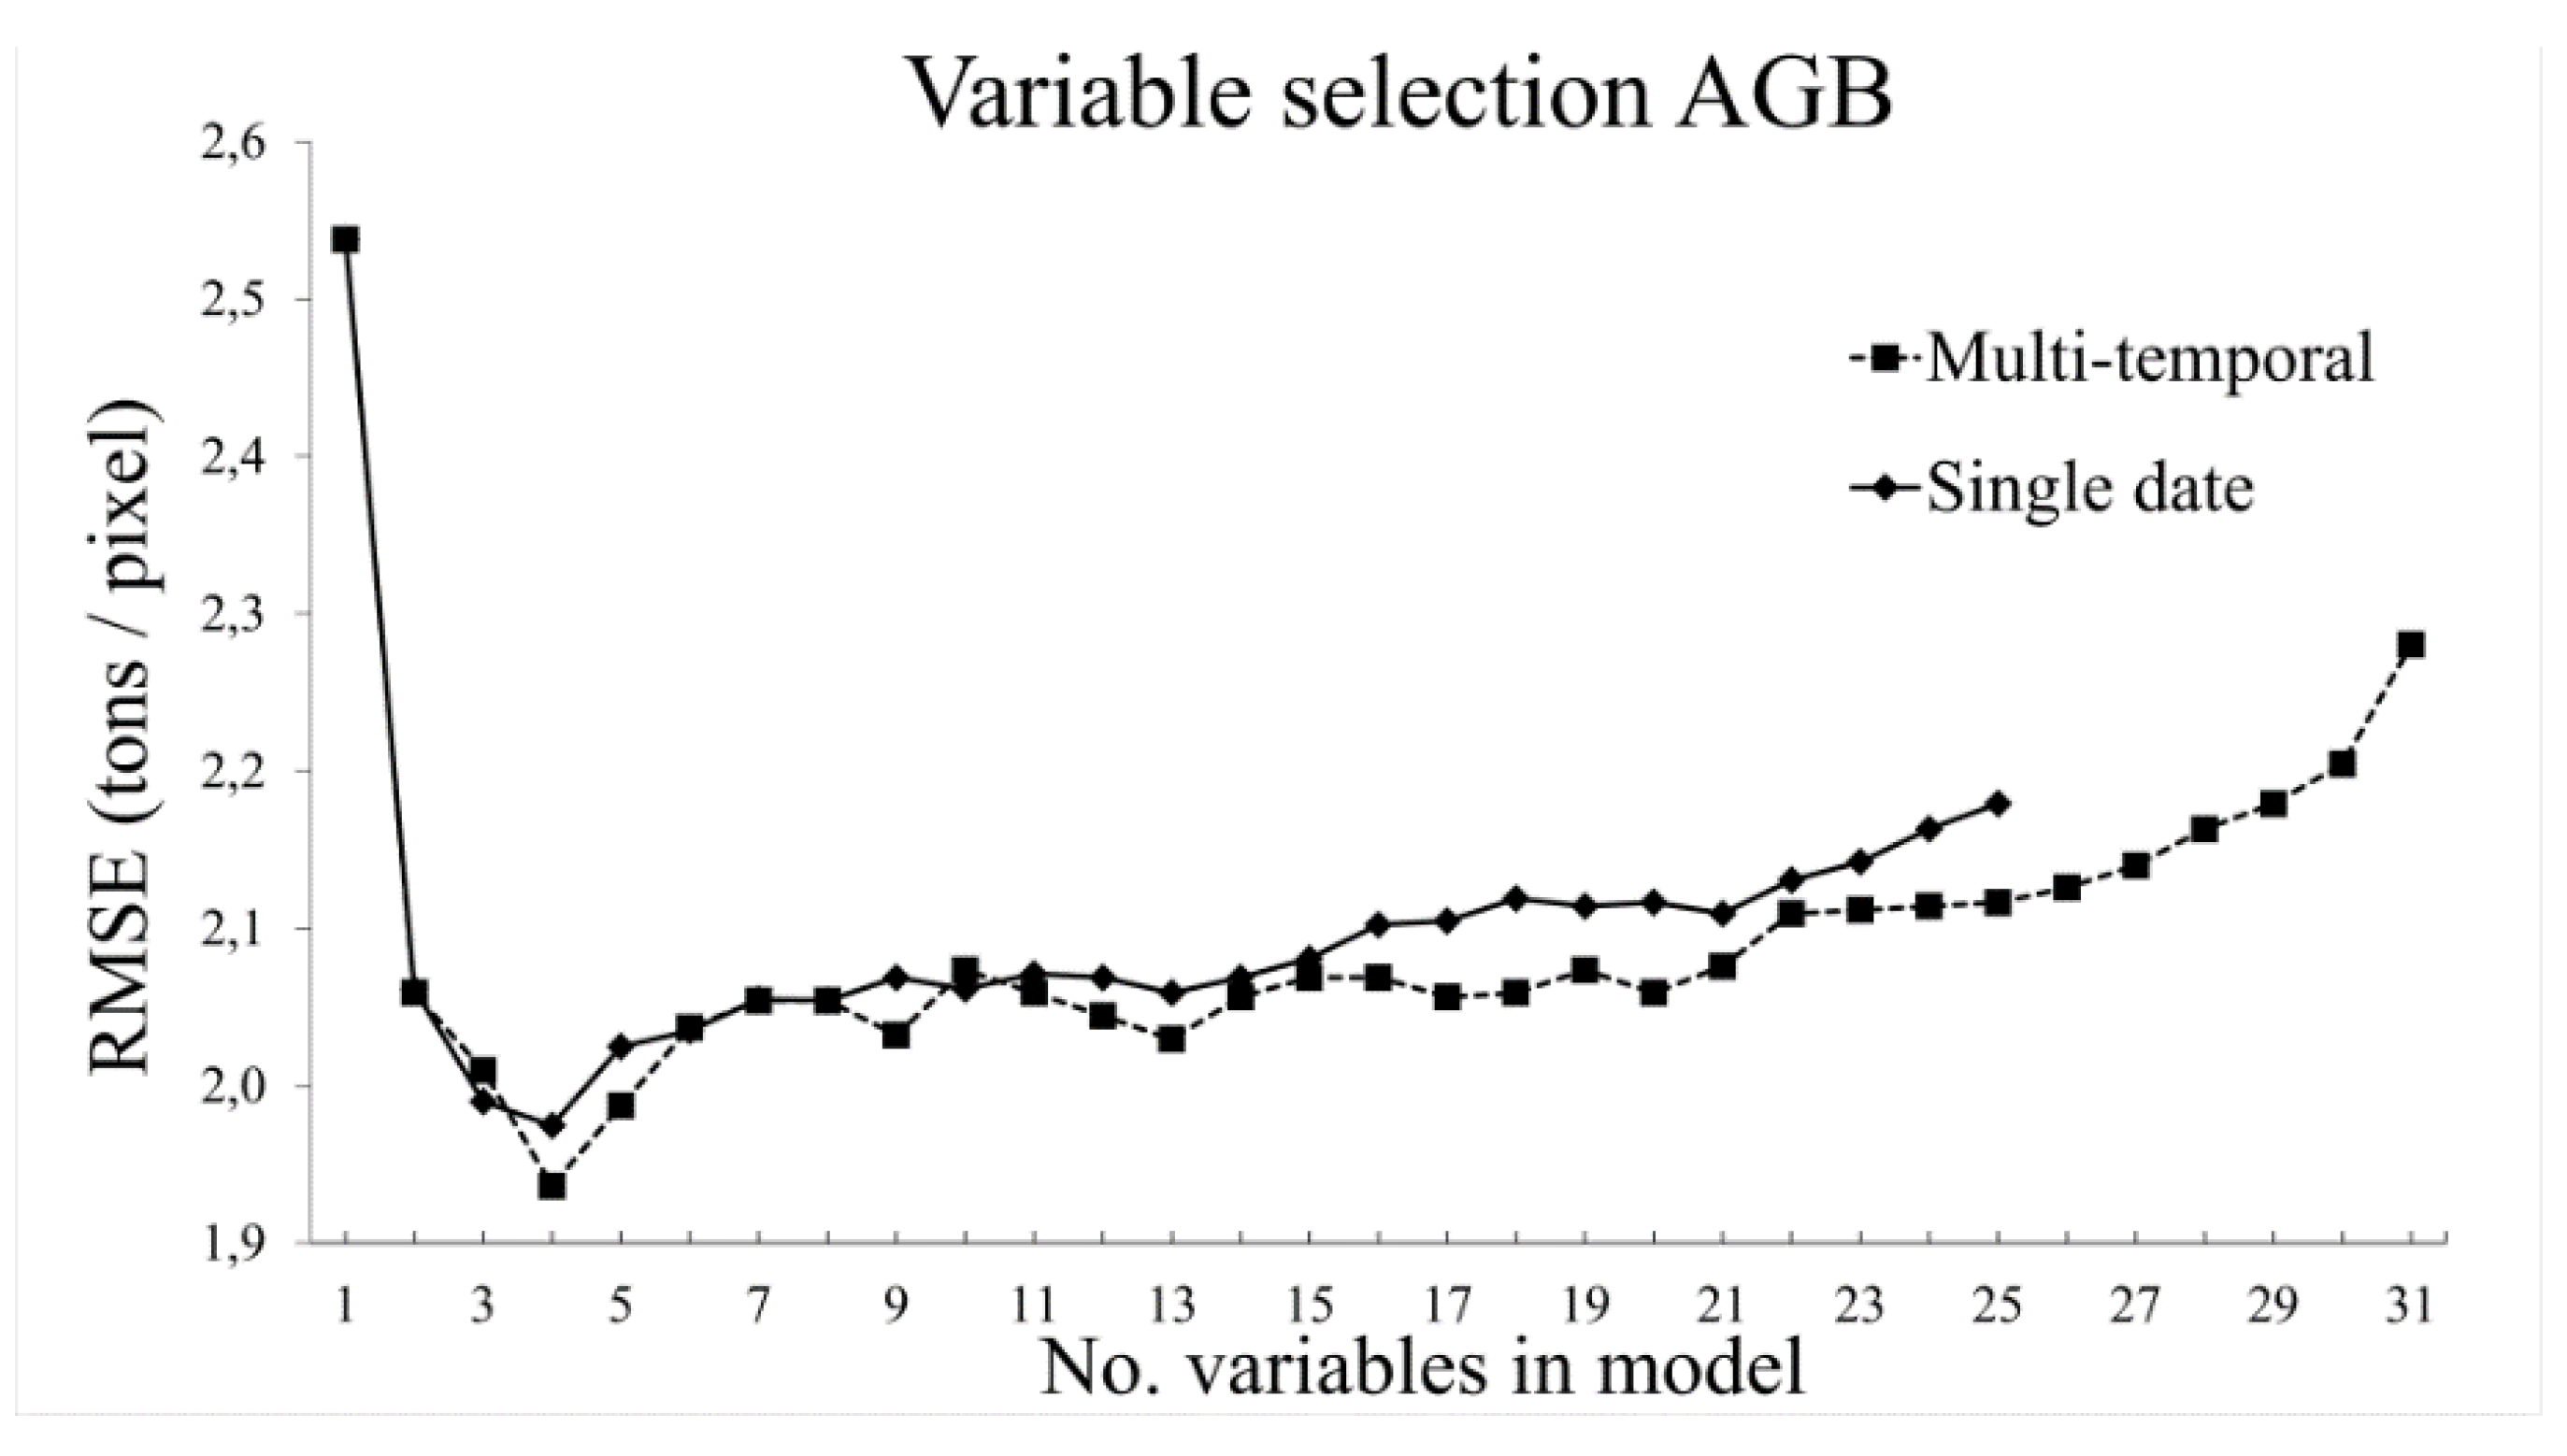
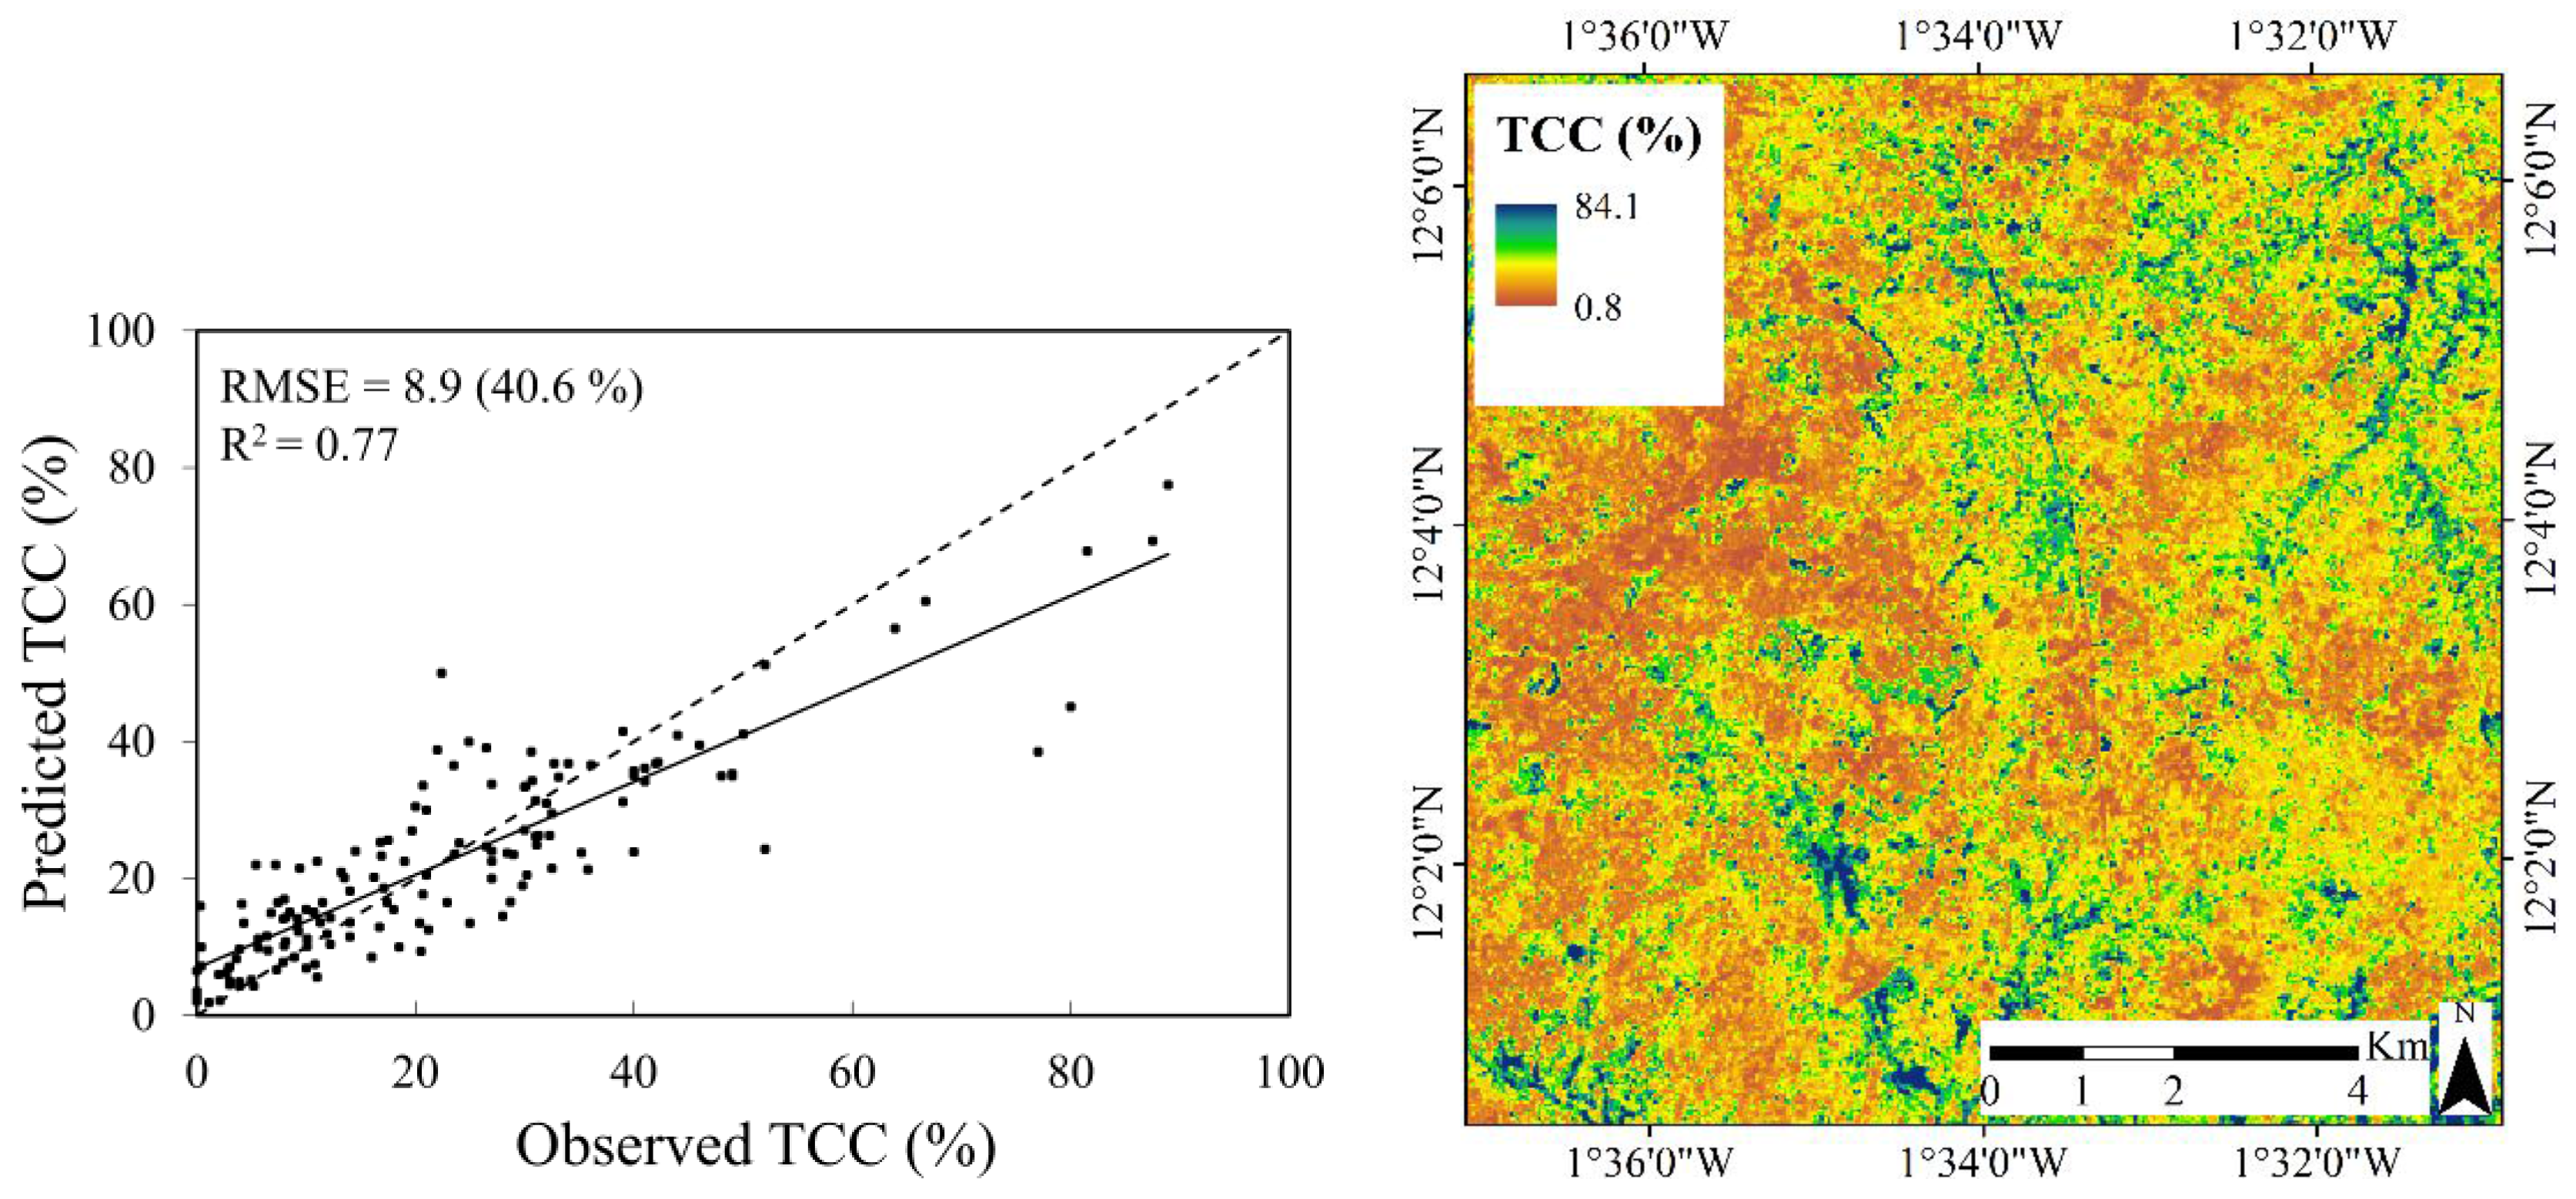
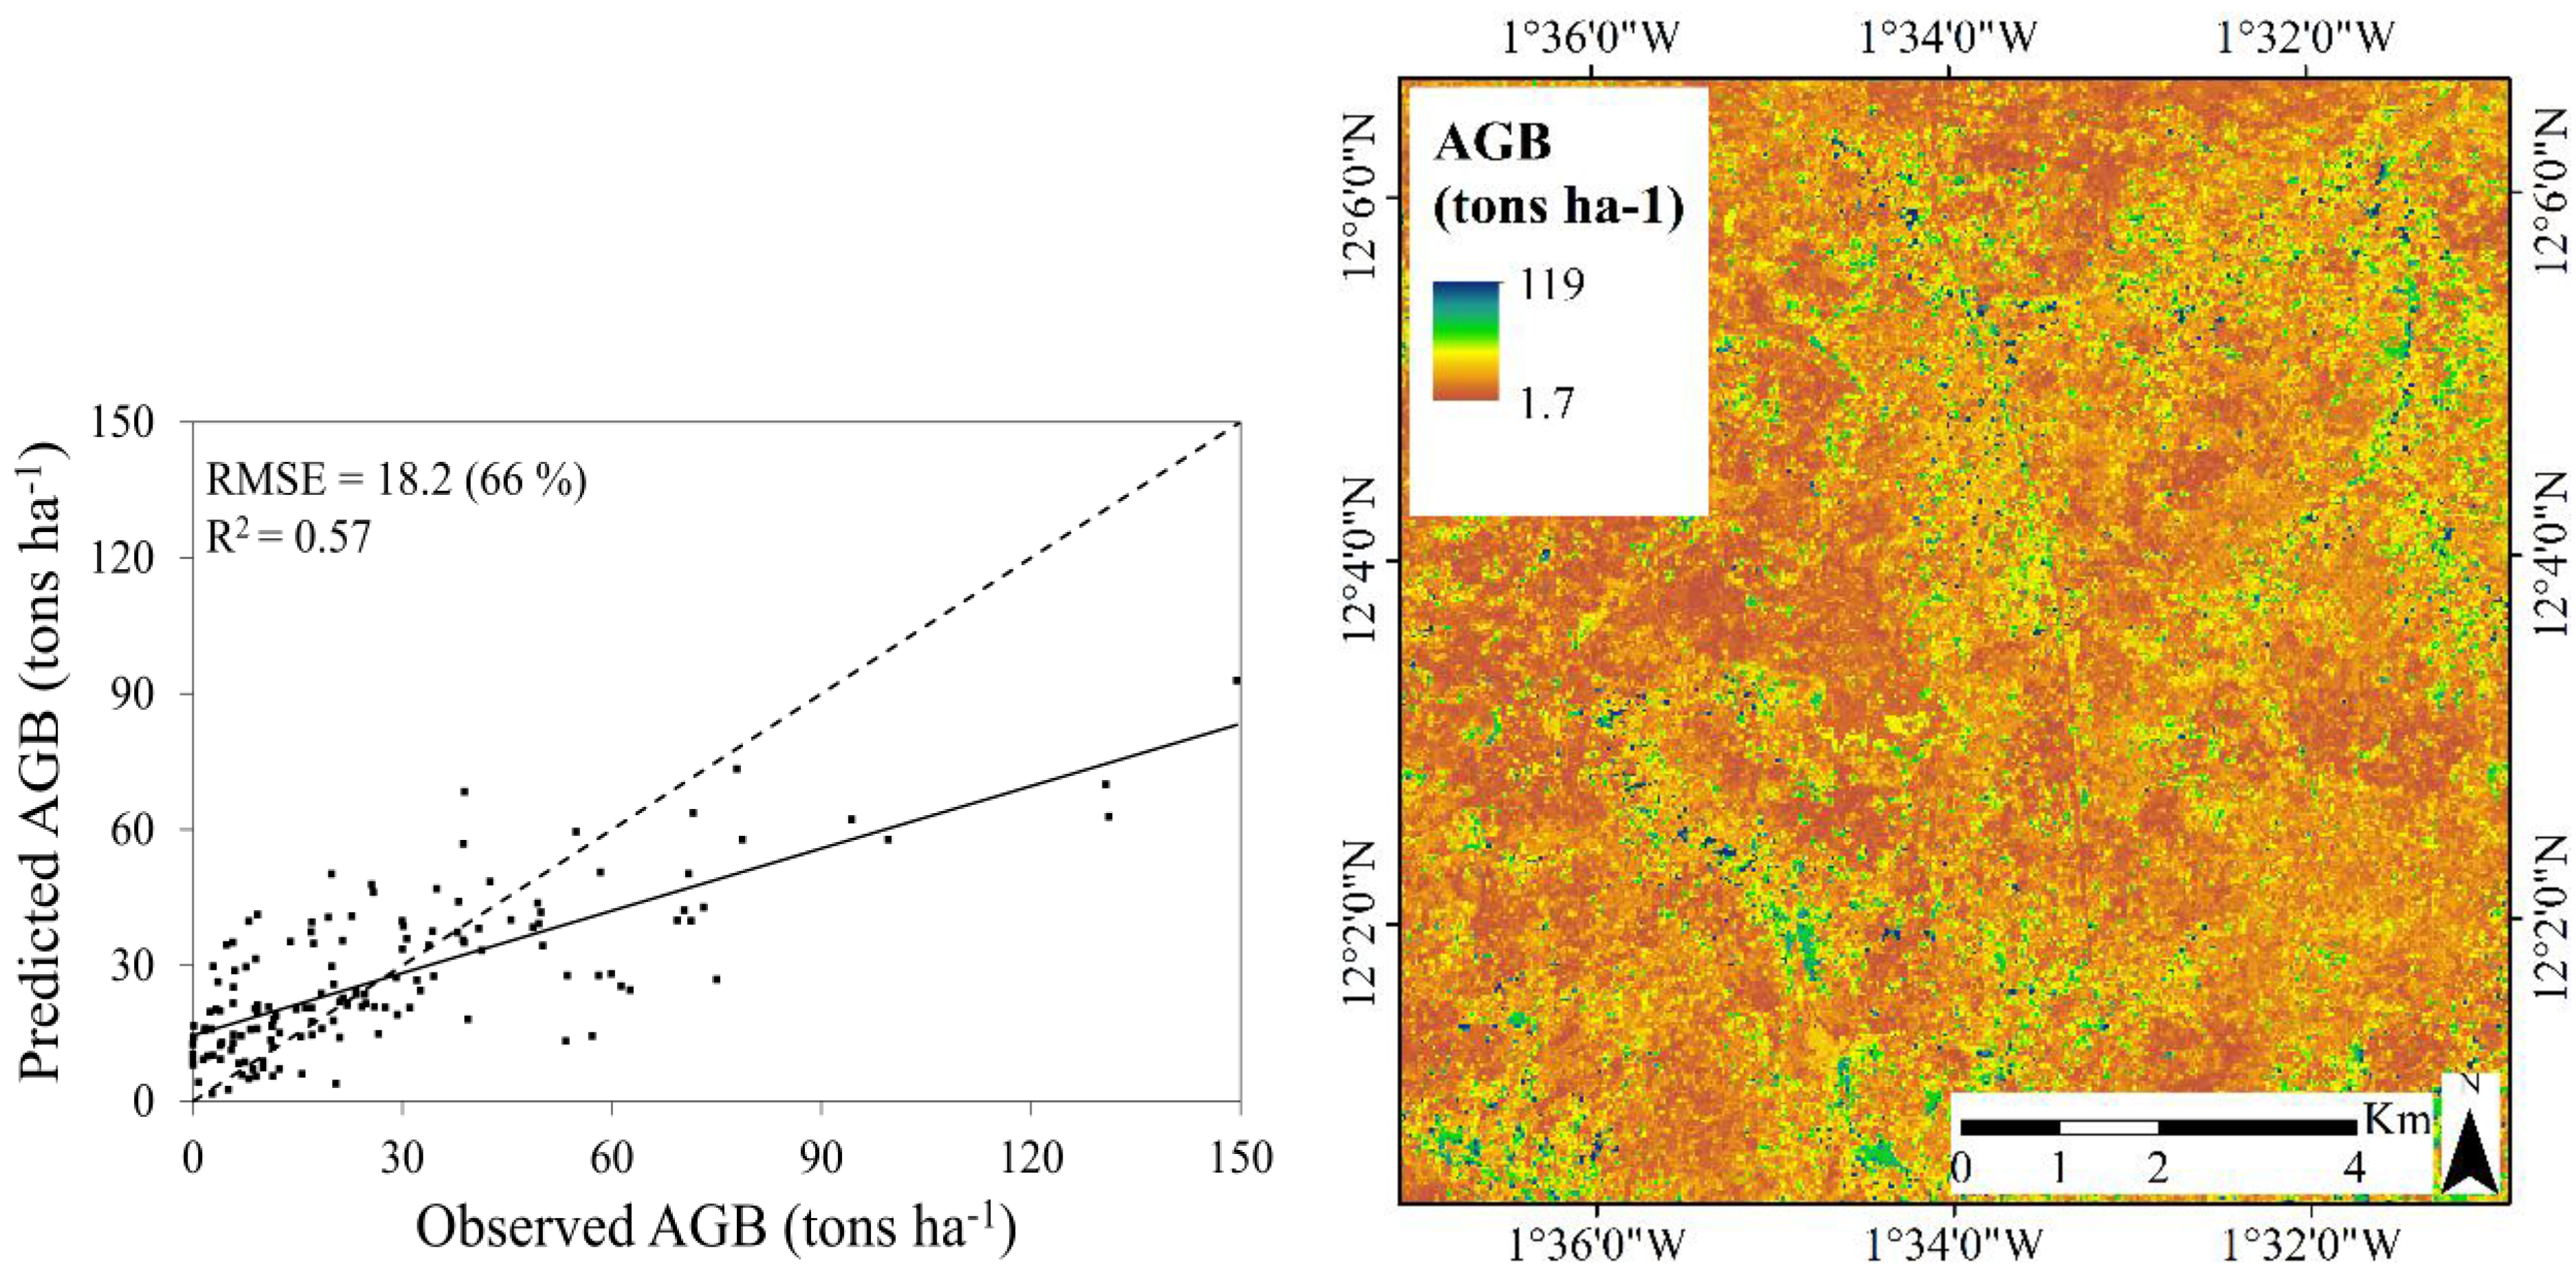
Accurate and timely maps of tree cover attributes are important tools for environmental research and natural resource management. We evaluate the utility of Landsat 8 for mapping tree canopy cover (TCC) and aboveground biomass (AGB) in a woodland landscape in Burkina Faso. Field data and WorldView-2 imagery were used to assemble the reference dataset. Spectral, texture, and phenology predictor variables were extracted from Landsat 8 imagery and used as input to Random Forest (RF) models. RF models based on multi-temporal and single date imagery were compared to determine the influence of phenology predictor variables. The effect of reducing the number of predictor variables on the RF predictions was also investigated. The model error was assessed using 10-fold cross validation. The most accurate models were created using multi-temporal imagery and variable selection, for both TCC (five predictor variables) and AGB (four predictor variables). The coefficient of determination of predicted versus observed values was 0.77 for TCC (RMSE = 8.9%) and 0.57 for AGB (RMSE = 17.6 tons∙ha−1). This mapping approach is based on freely available Landsat 8 data and relatively simple analytical methods, and is therefore applicable in woodland areas where sufficient reference data are available. View Full-Text
Keywords: Landsat 8; woodland; Sudano-Sahel; tree canopy cover; aboveground biomass; multi-temporal imagery; Random Forest; variable selection; phenology
▼ Figures
This is an open access article distributed under the Creative Commons Attribution License which permits unrestricted use, distribution, and reproduction in any medium, provided the original work is properly cited. (CC BY 4.0).
For further details log on website :
http://www.mdpi.com/2072-4292/7/8/10017


No comments:
Post a Comment