1
IRSTEA, UMR TETIS, 500 rue Jean François Breton, 34093 Montpellier Cedex 5, France
2
AgroParisTech, UMR LISAH, 2 place Pierre Viala, 34060 Montpellier, France
3
IRD, UMP AMAP, Bd de la Lironde, TA A51/PS2, 34398 Montpellier Cedex 5, France
4
CIRAD, UPR B&SEF, campus international de Baillarguet, 34398 Montpellier Cedex 5, France
5
NOVELTIS, 153 rue du Lac, 31670 Labège, France
6
Airbus Defense and Space, 31 rue des Cosmonautes Z.I. du Palays, 31402 Toulouse, France
7
BRGM, 3 avenue Claude Guillemin, 45060 Orléans, France
*
Author to whom correspondence should be addressed.
Received: 10 June 2014 / Revised: 11 November 2014 / Accepted: 17 November 2014 / Published: 28 November 2014
Abstract
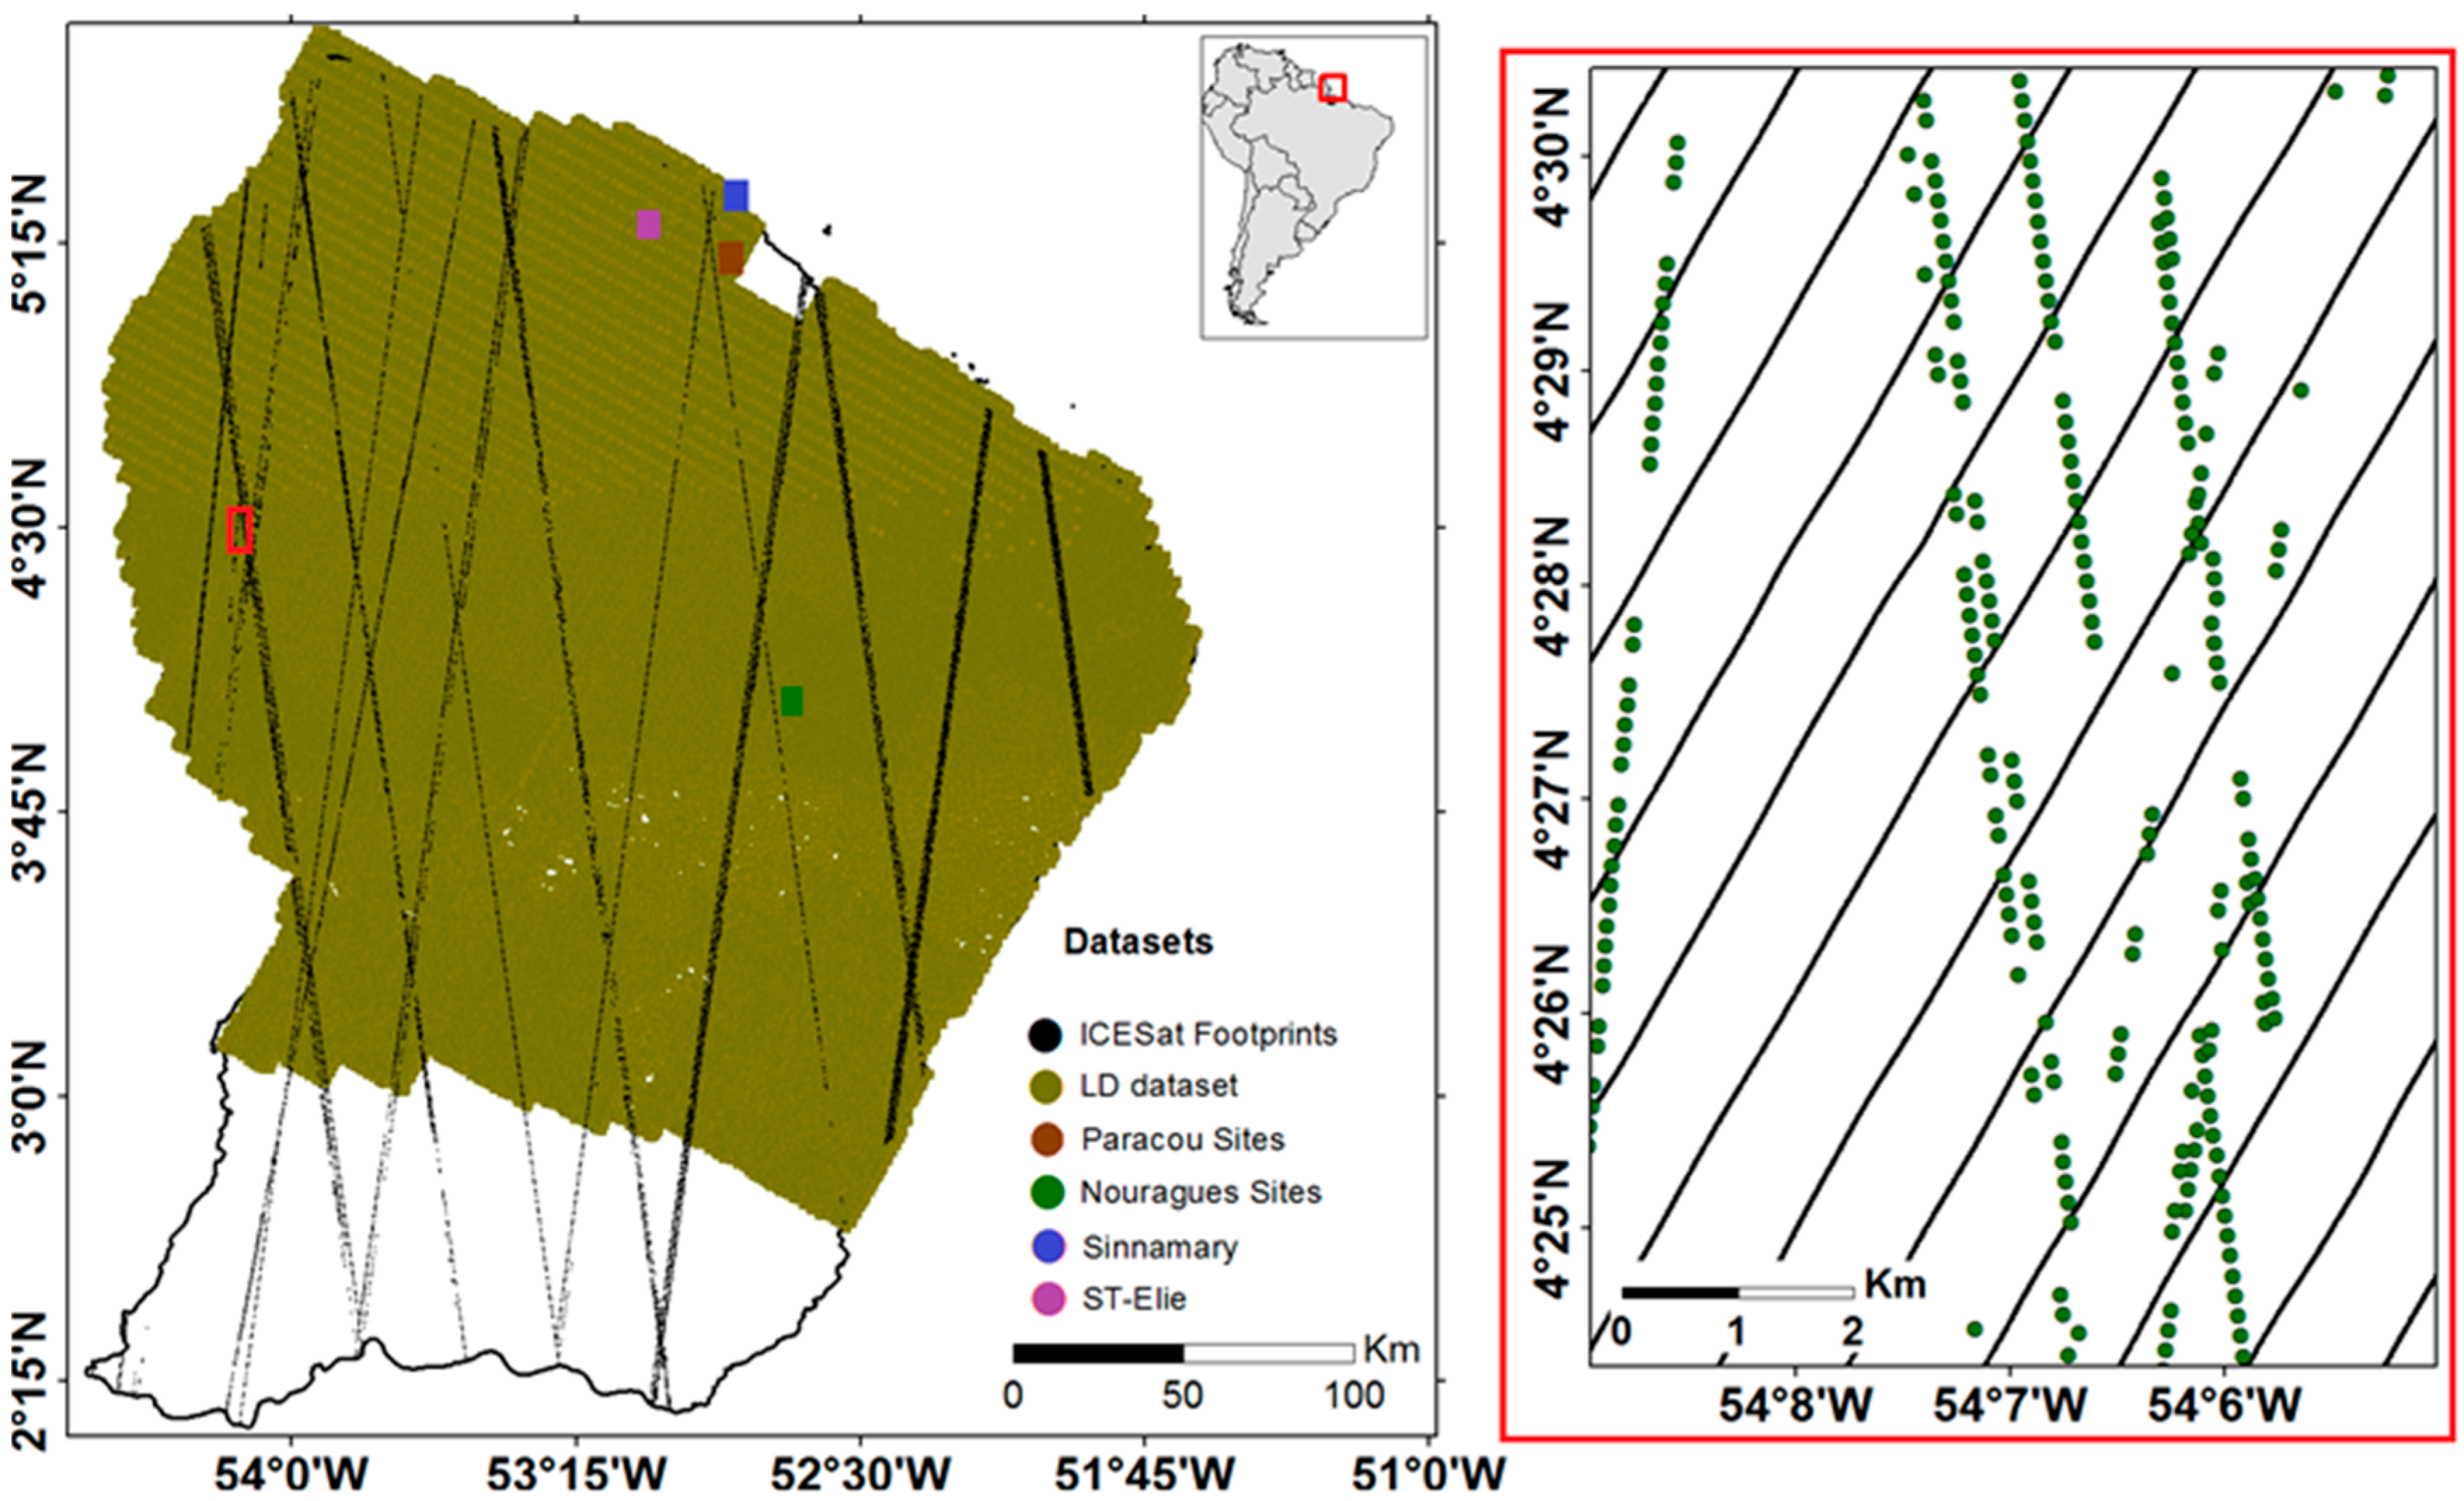
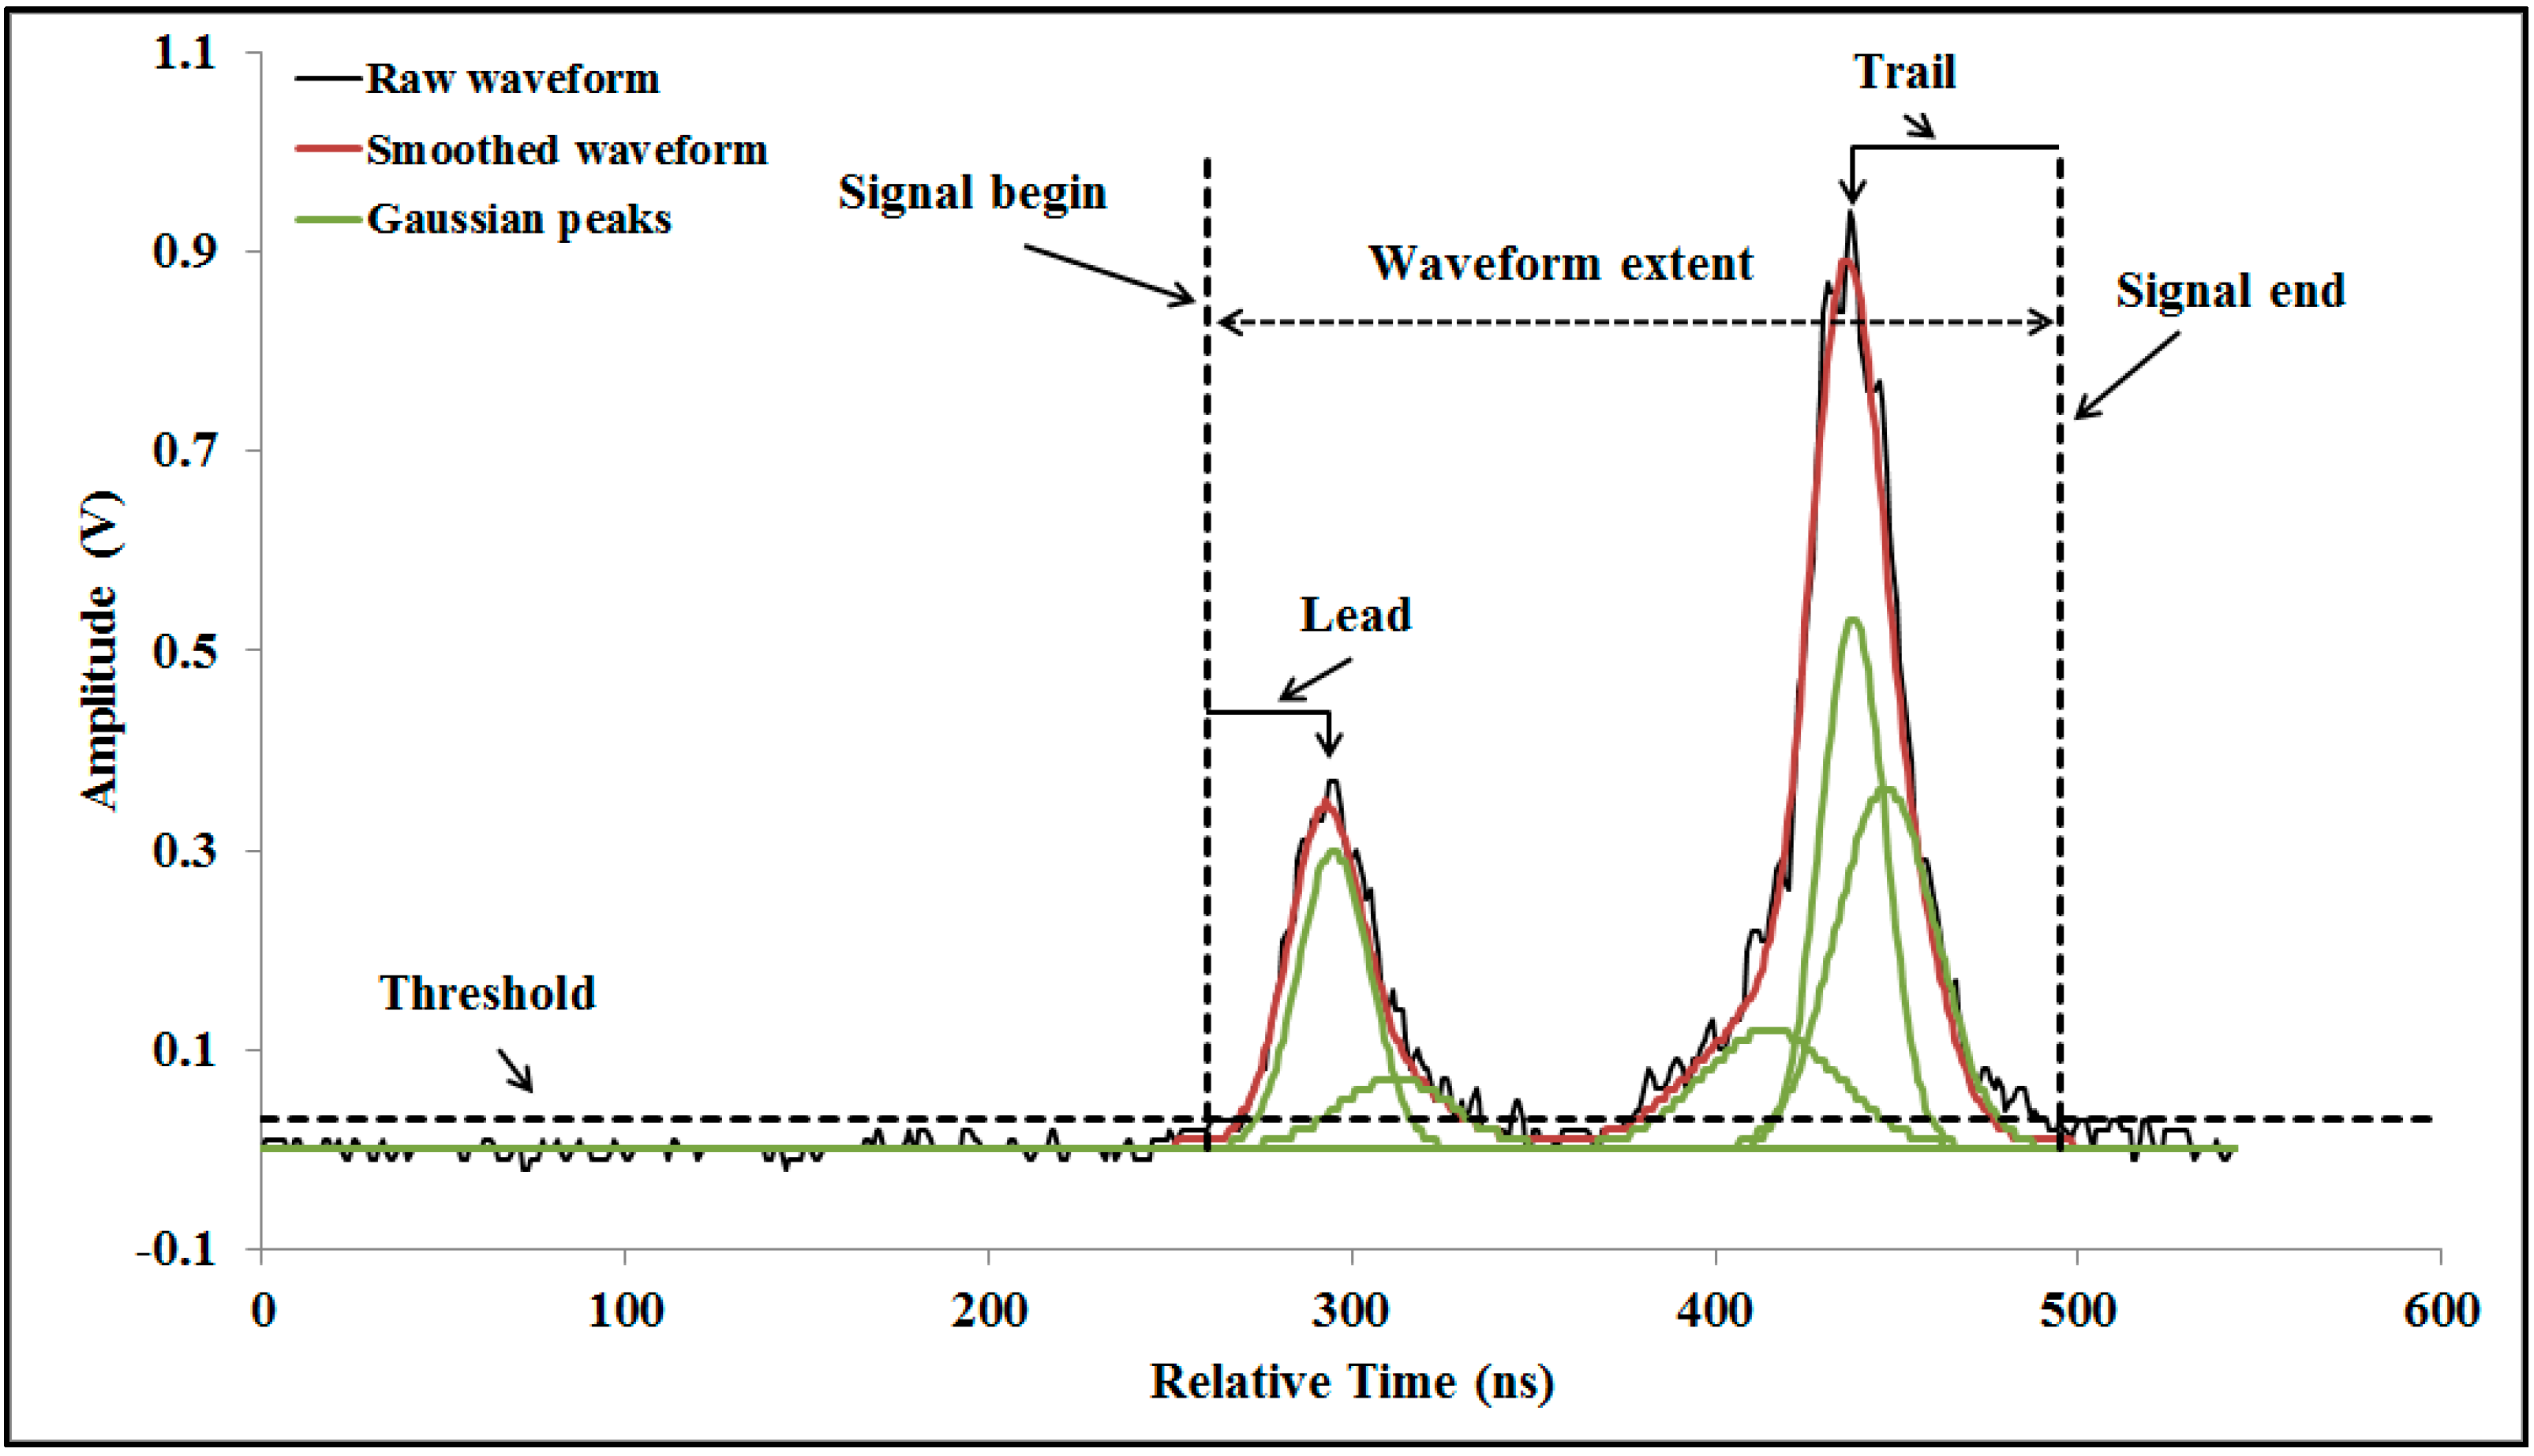
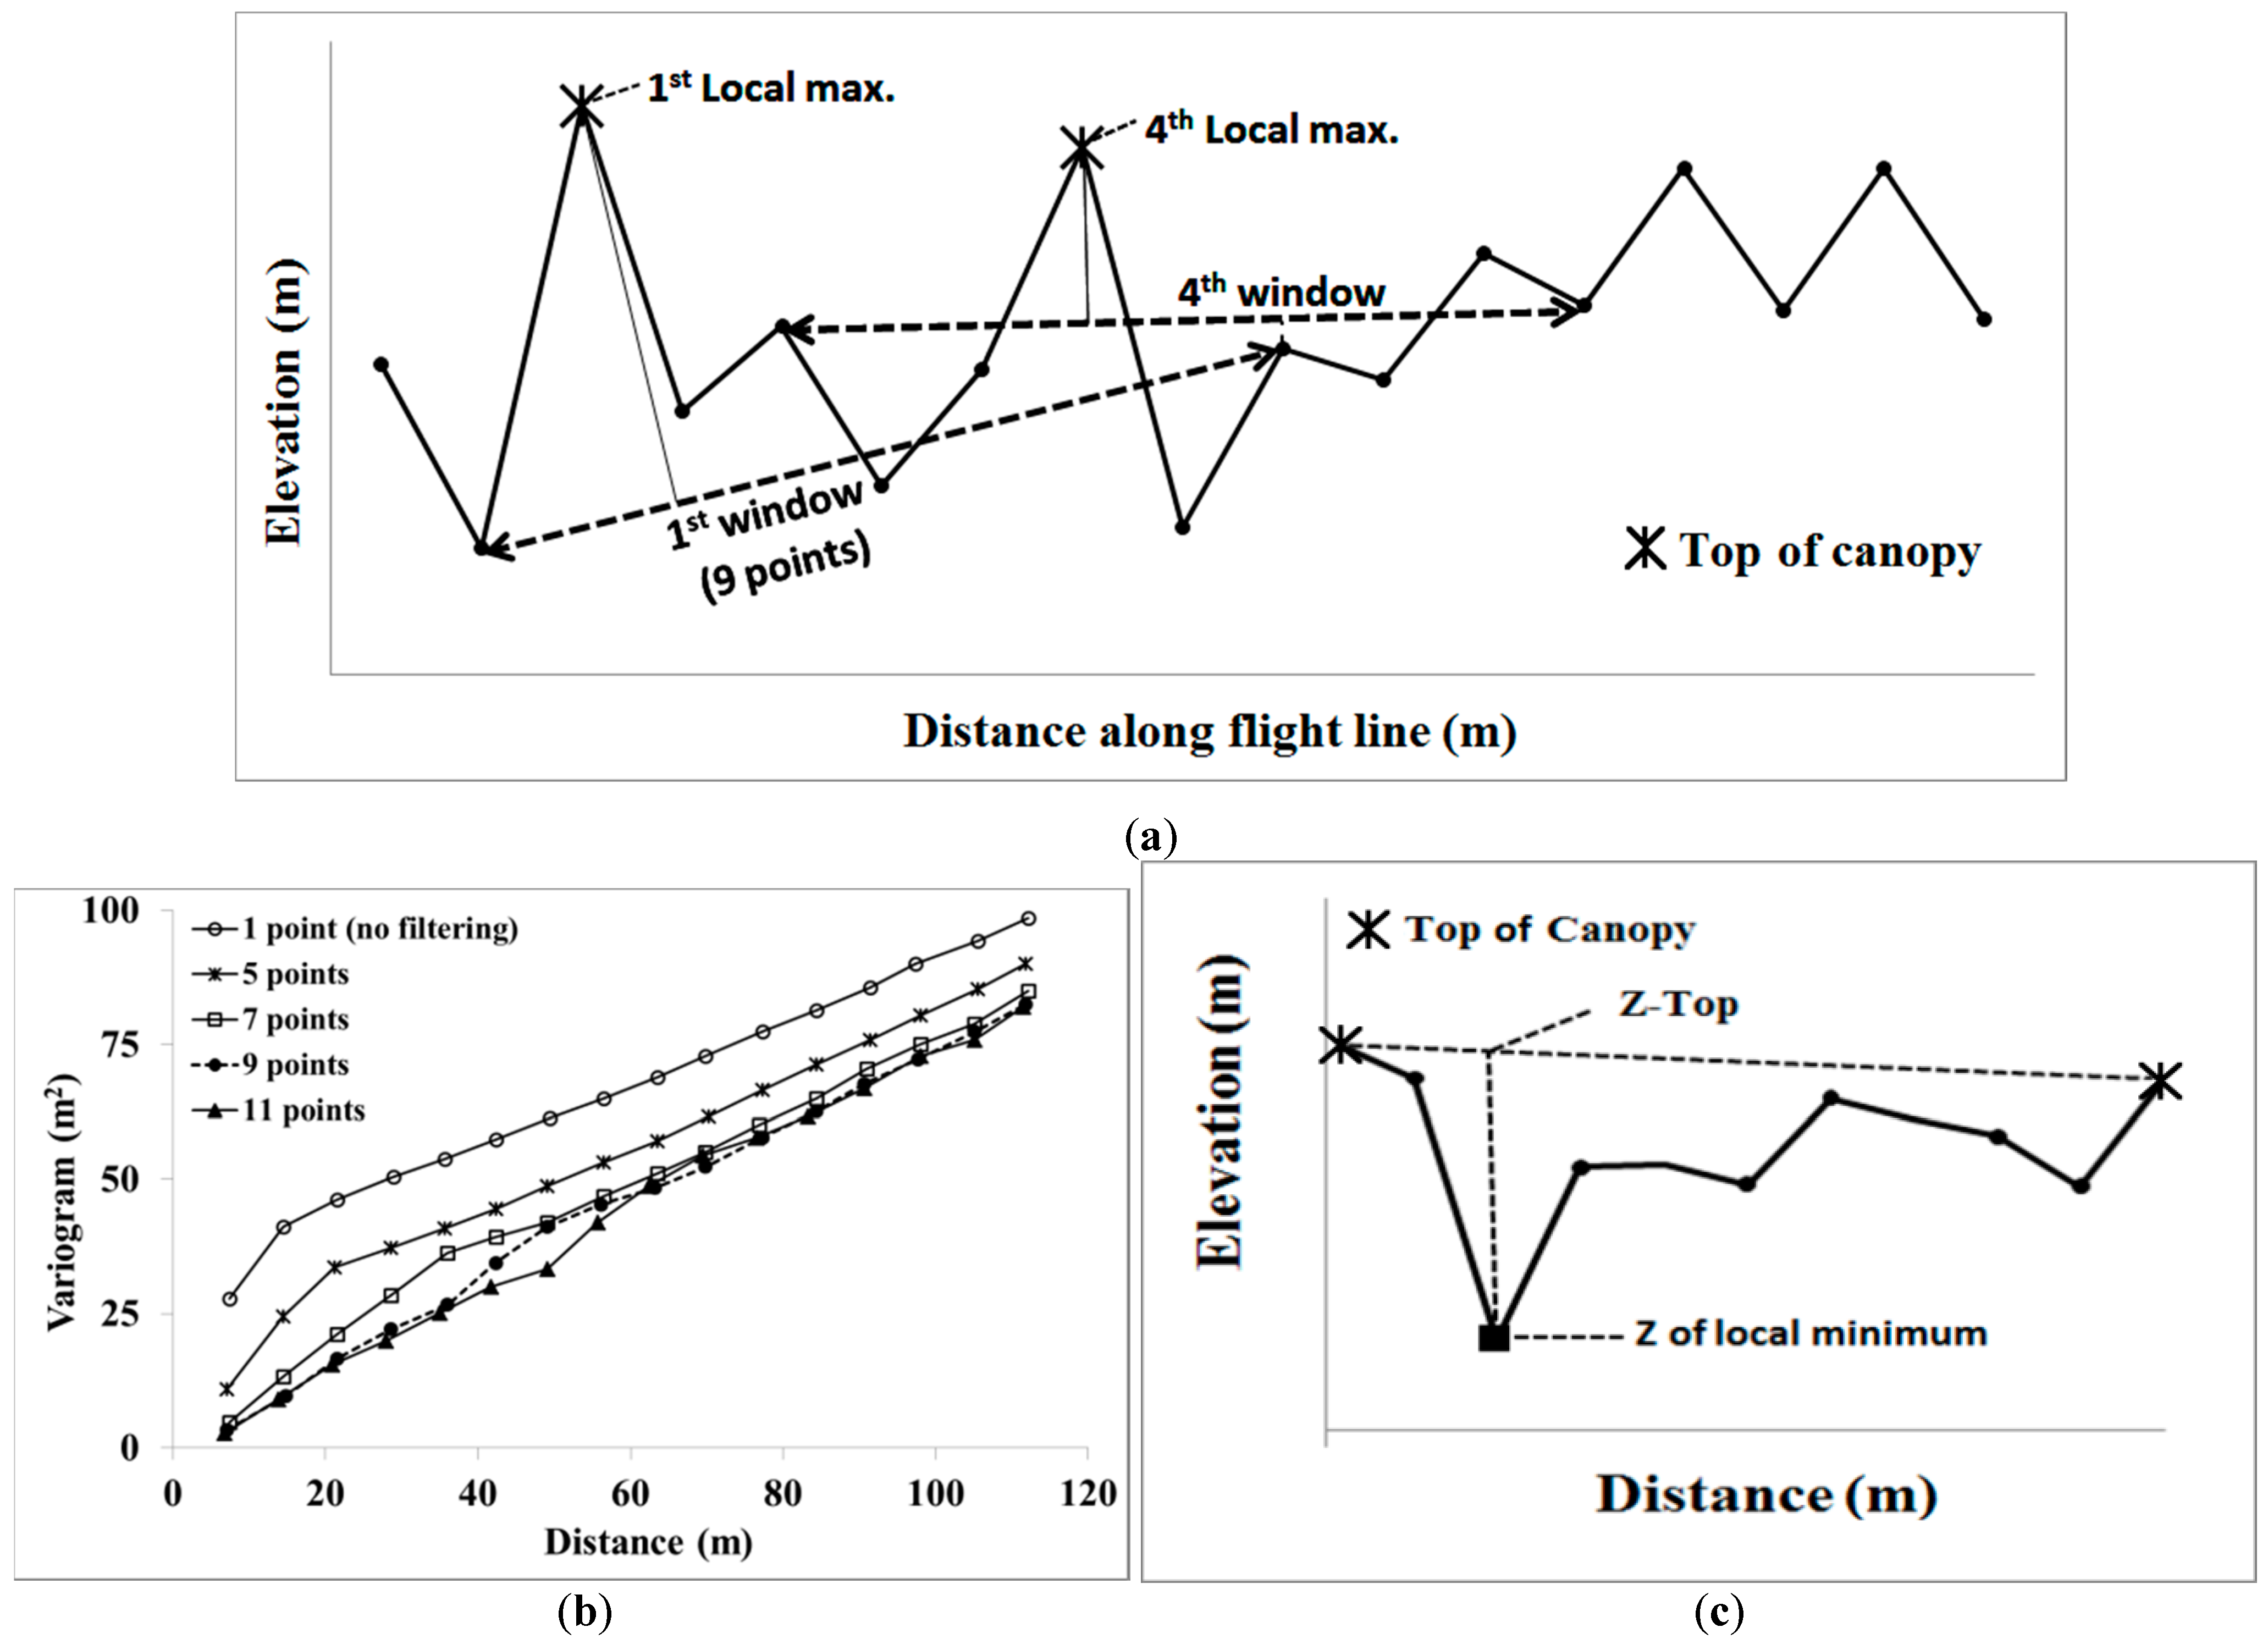
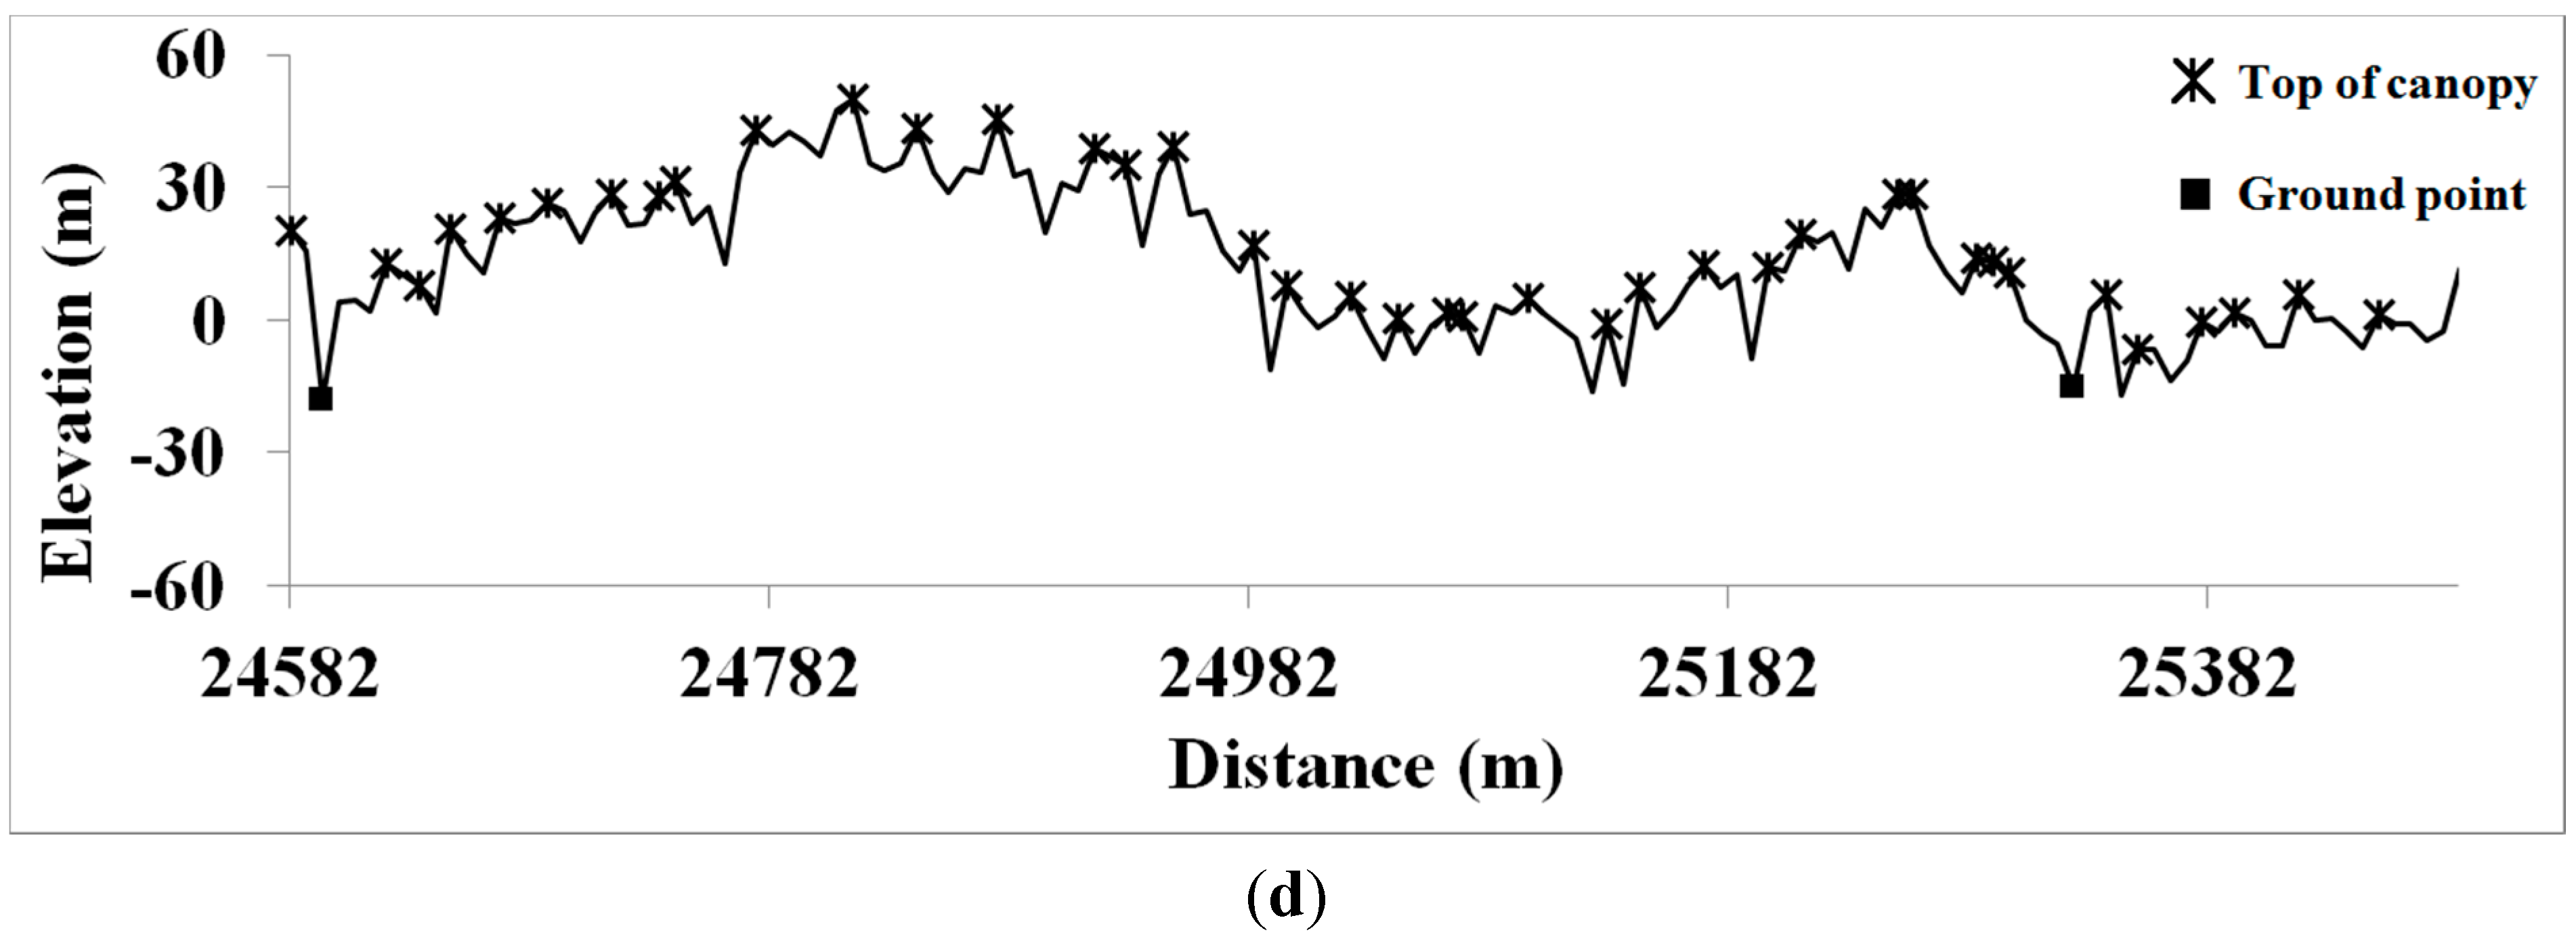
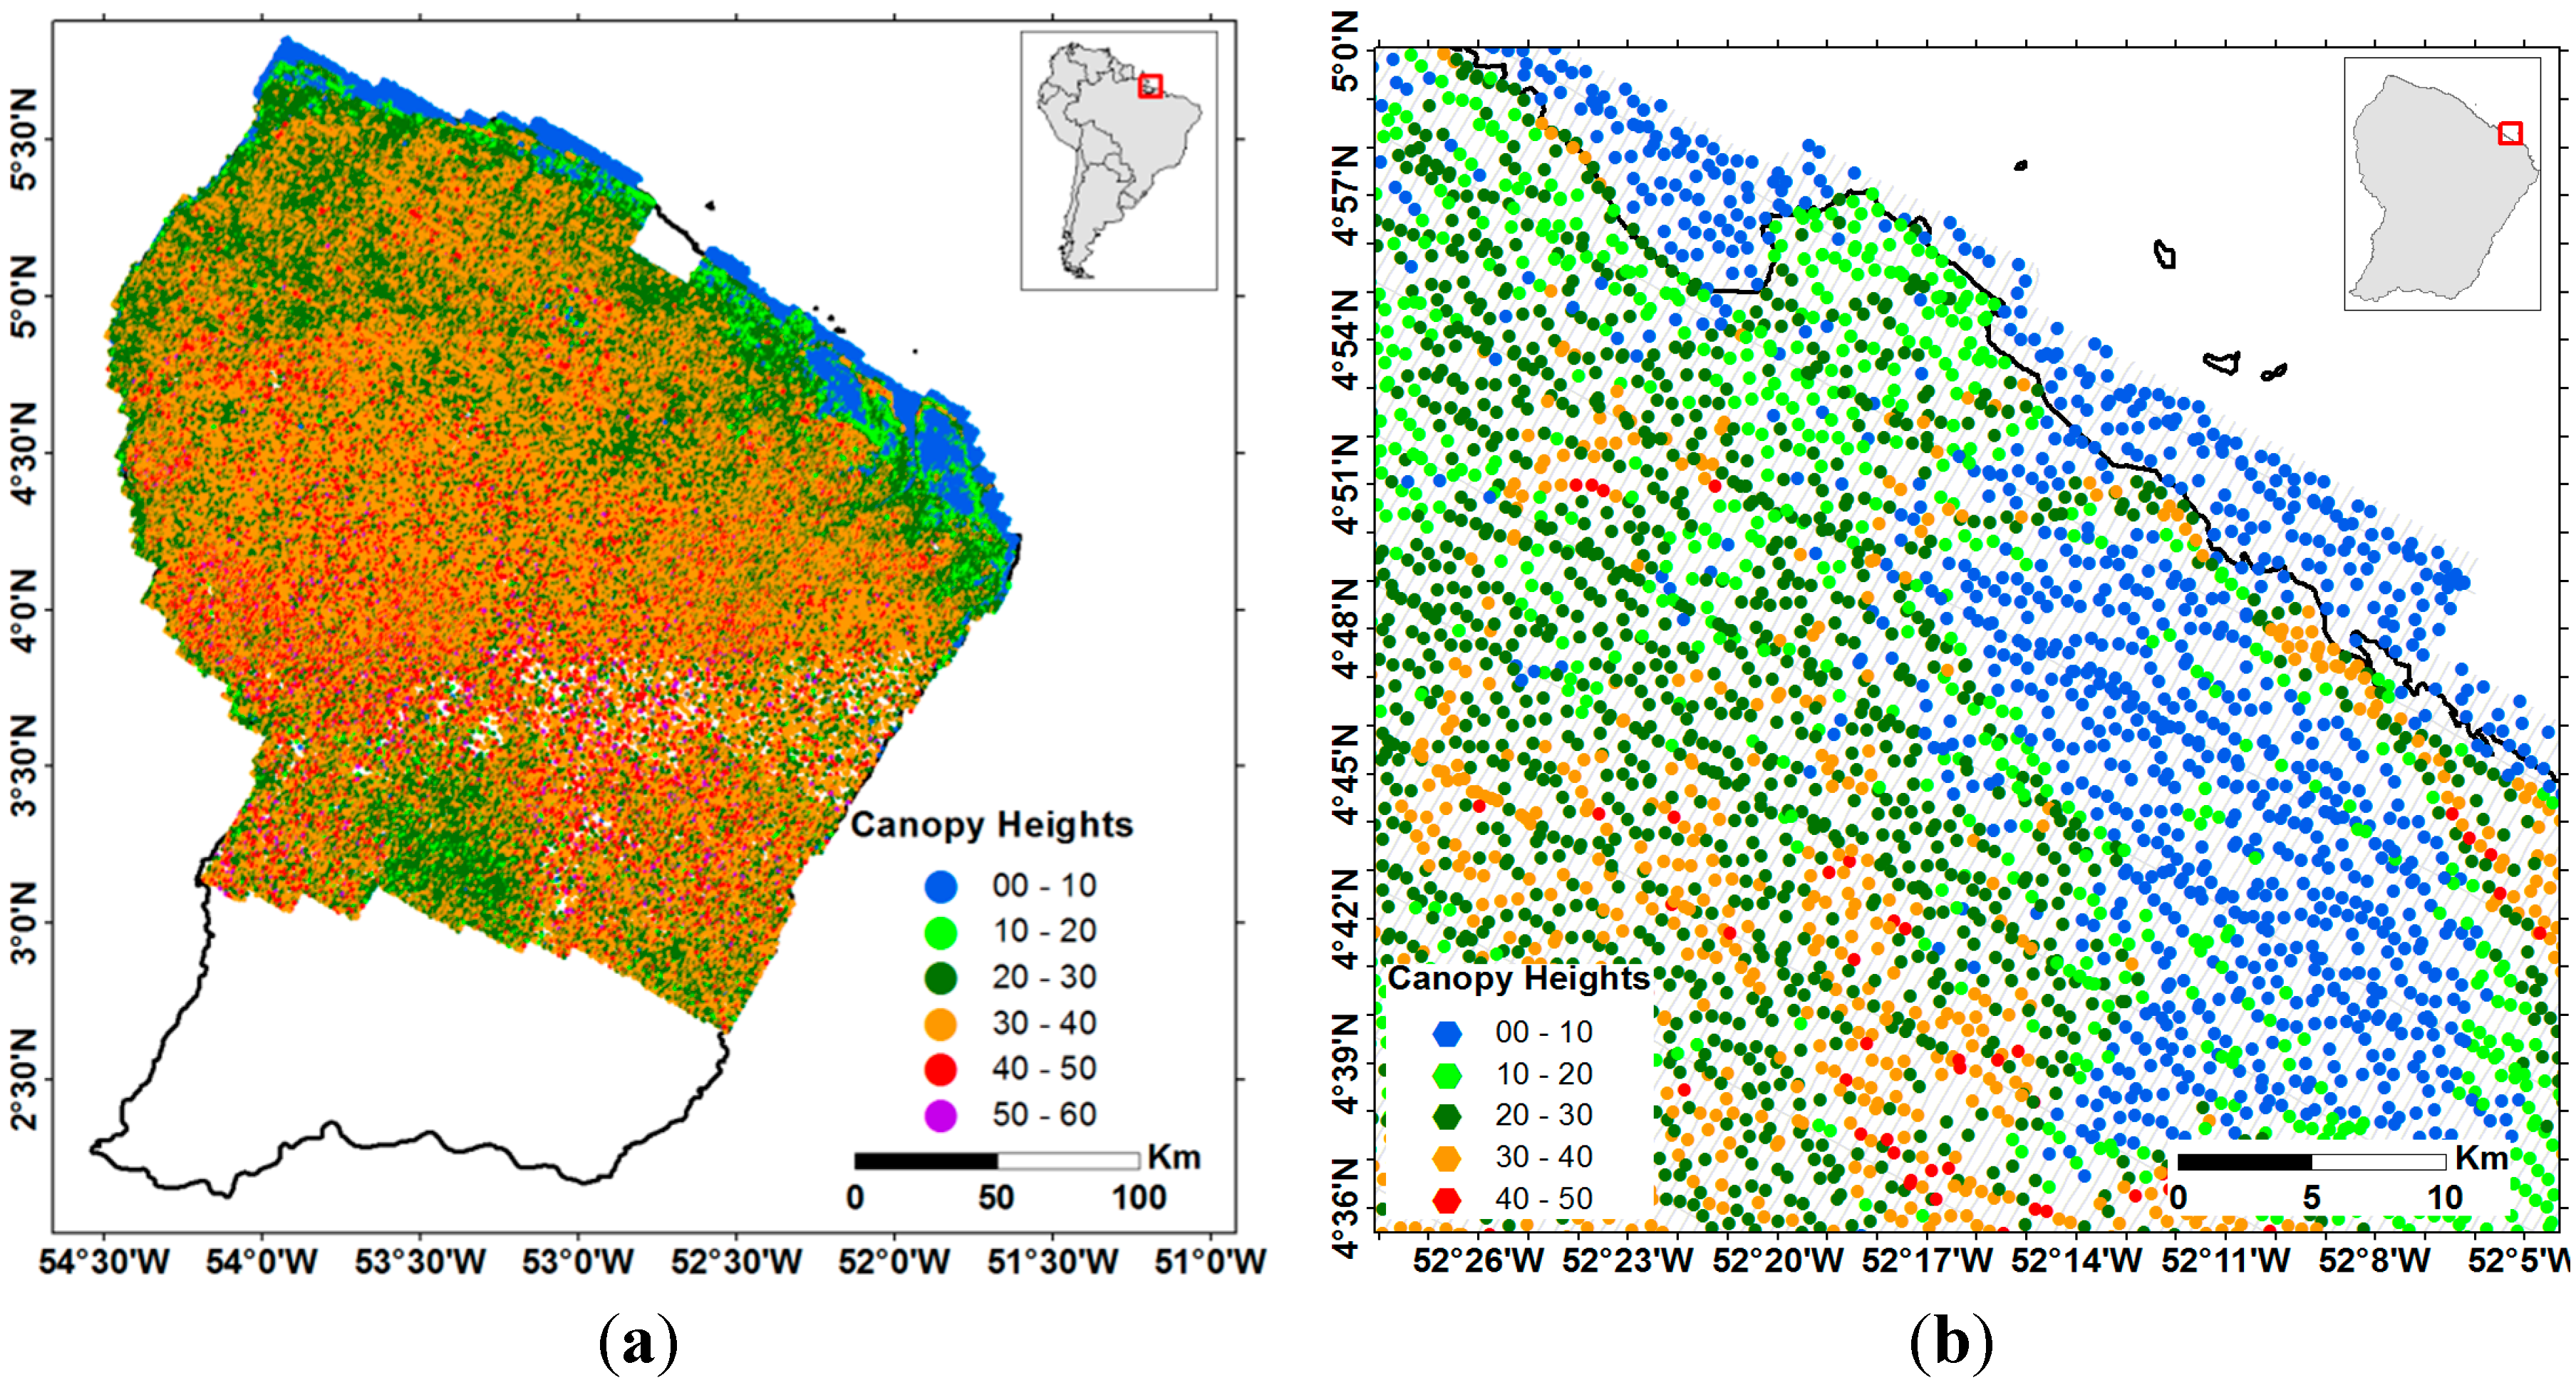
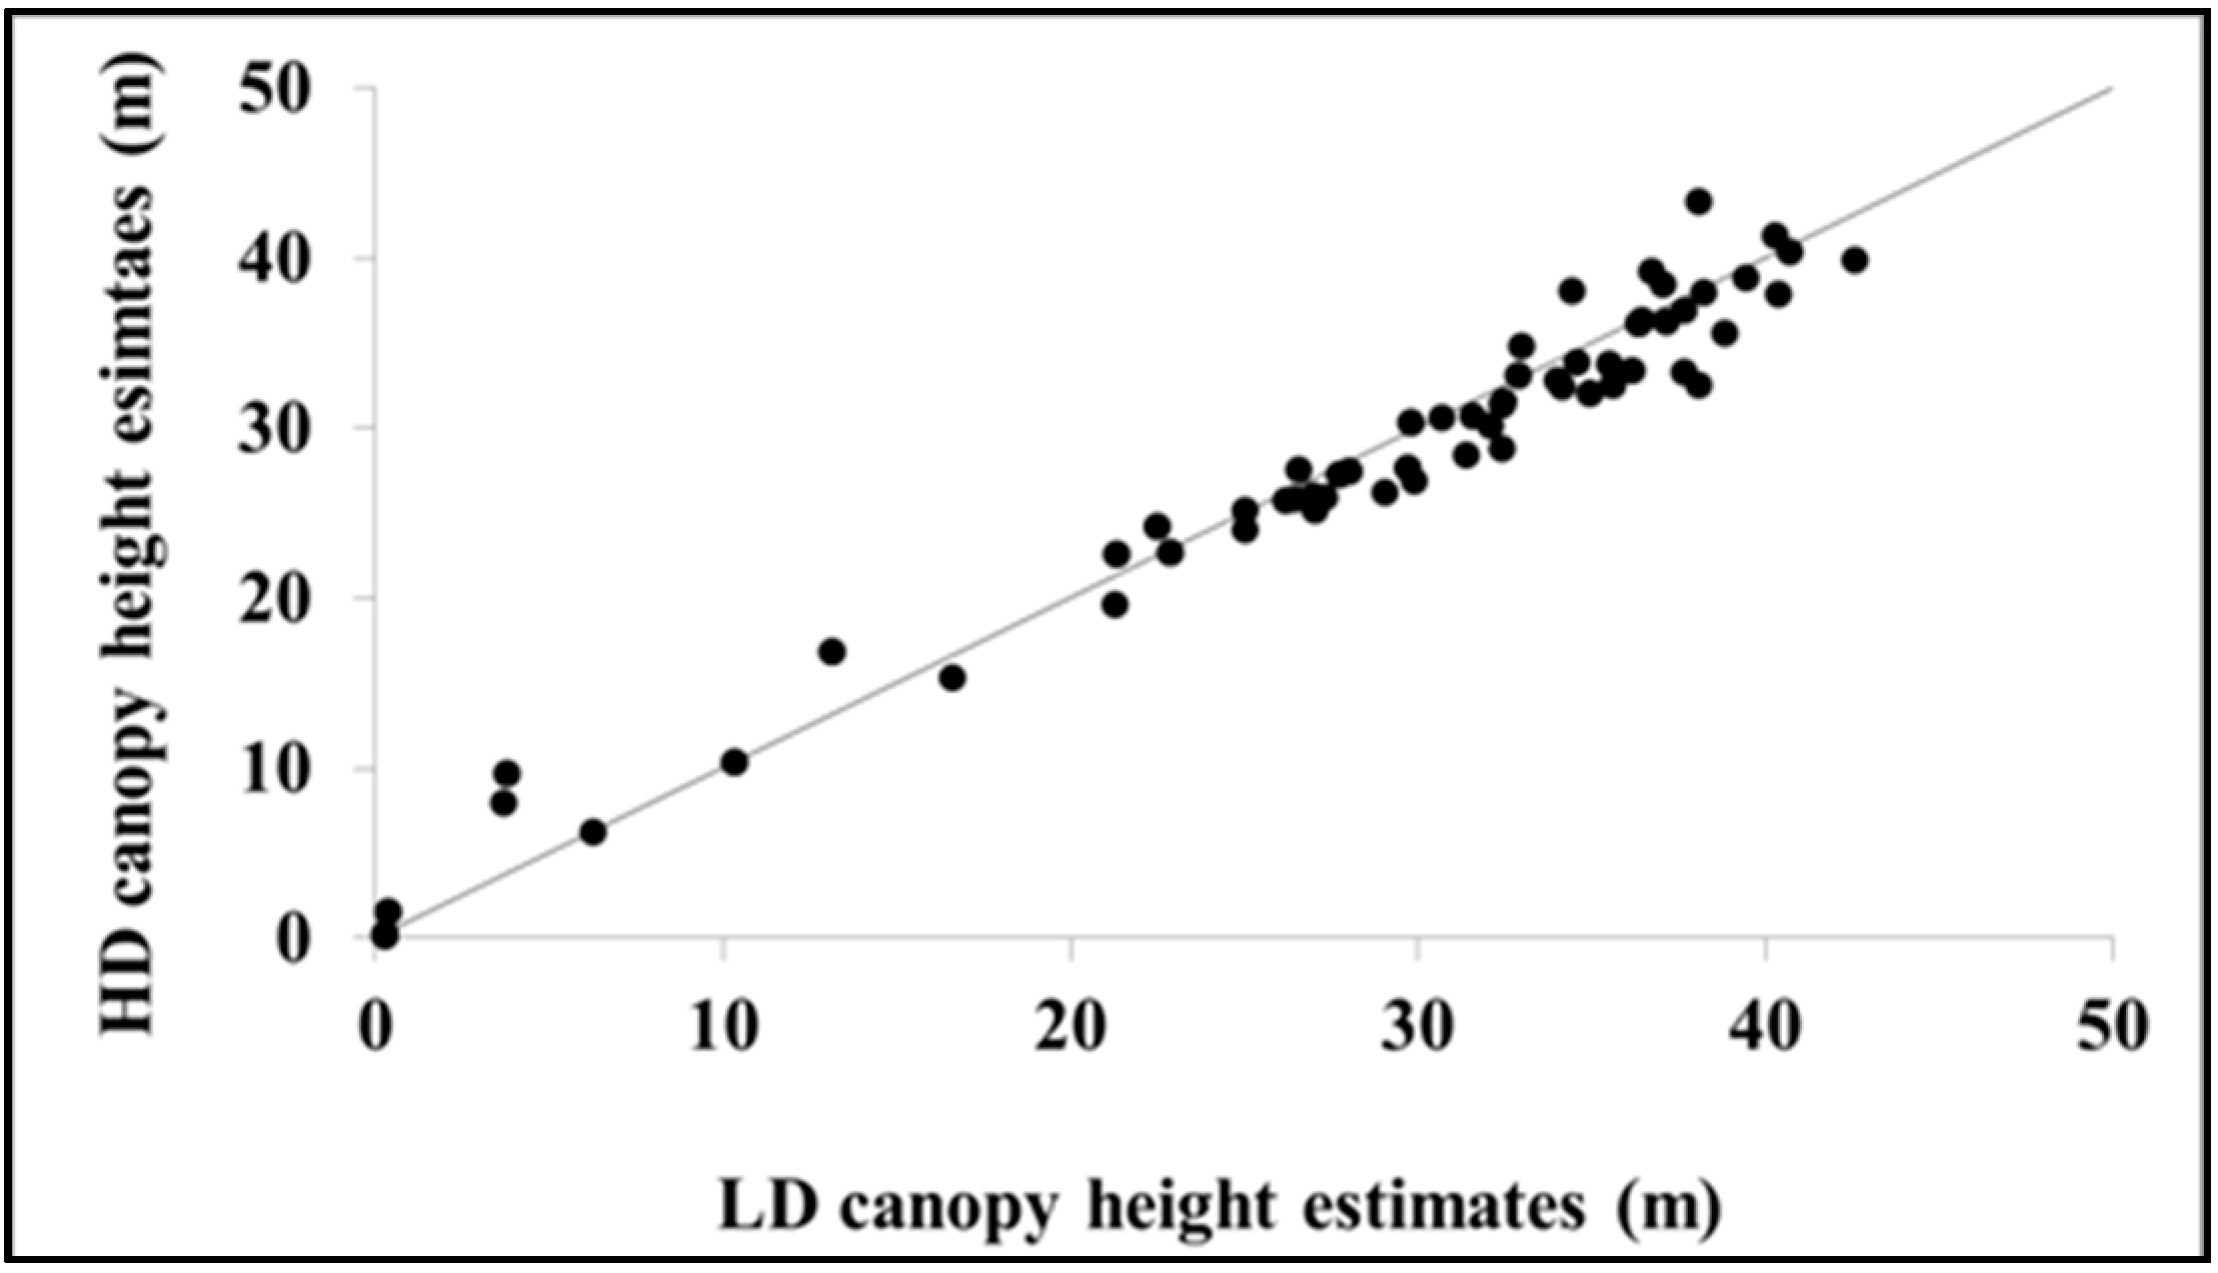
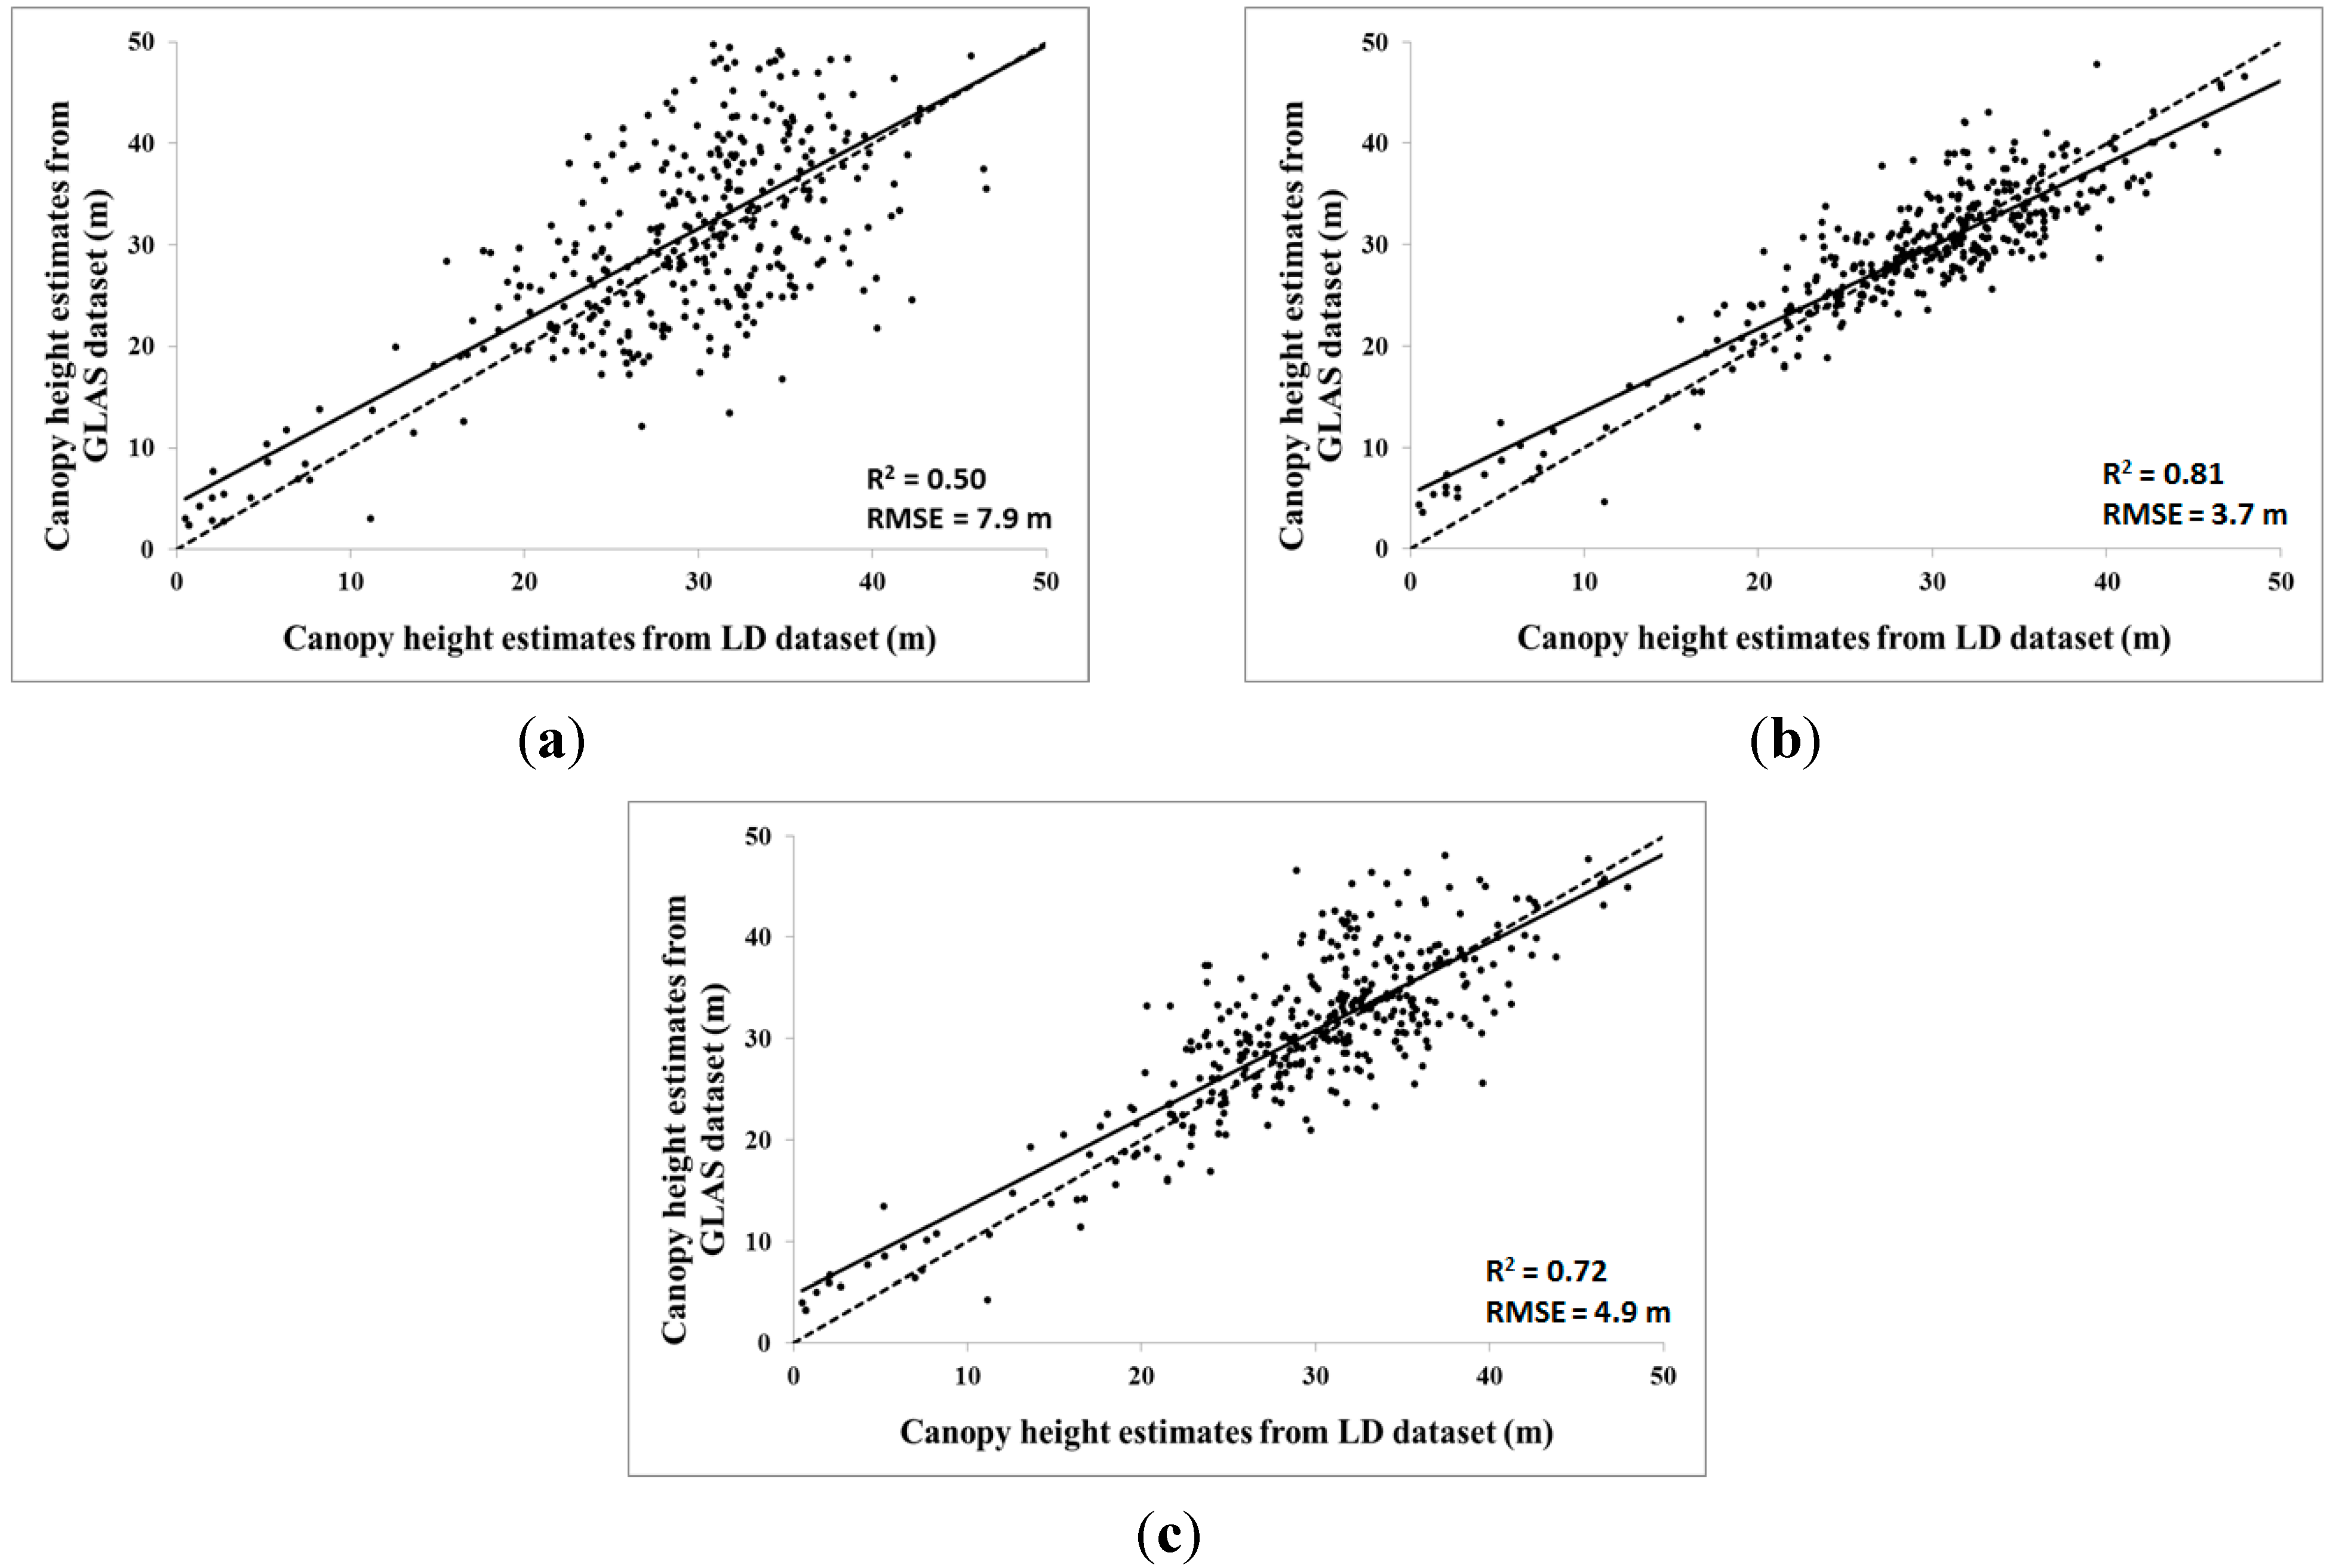
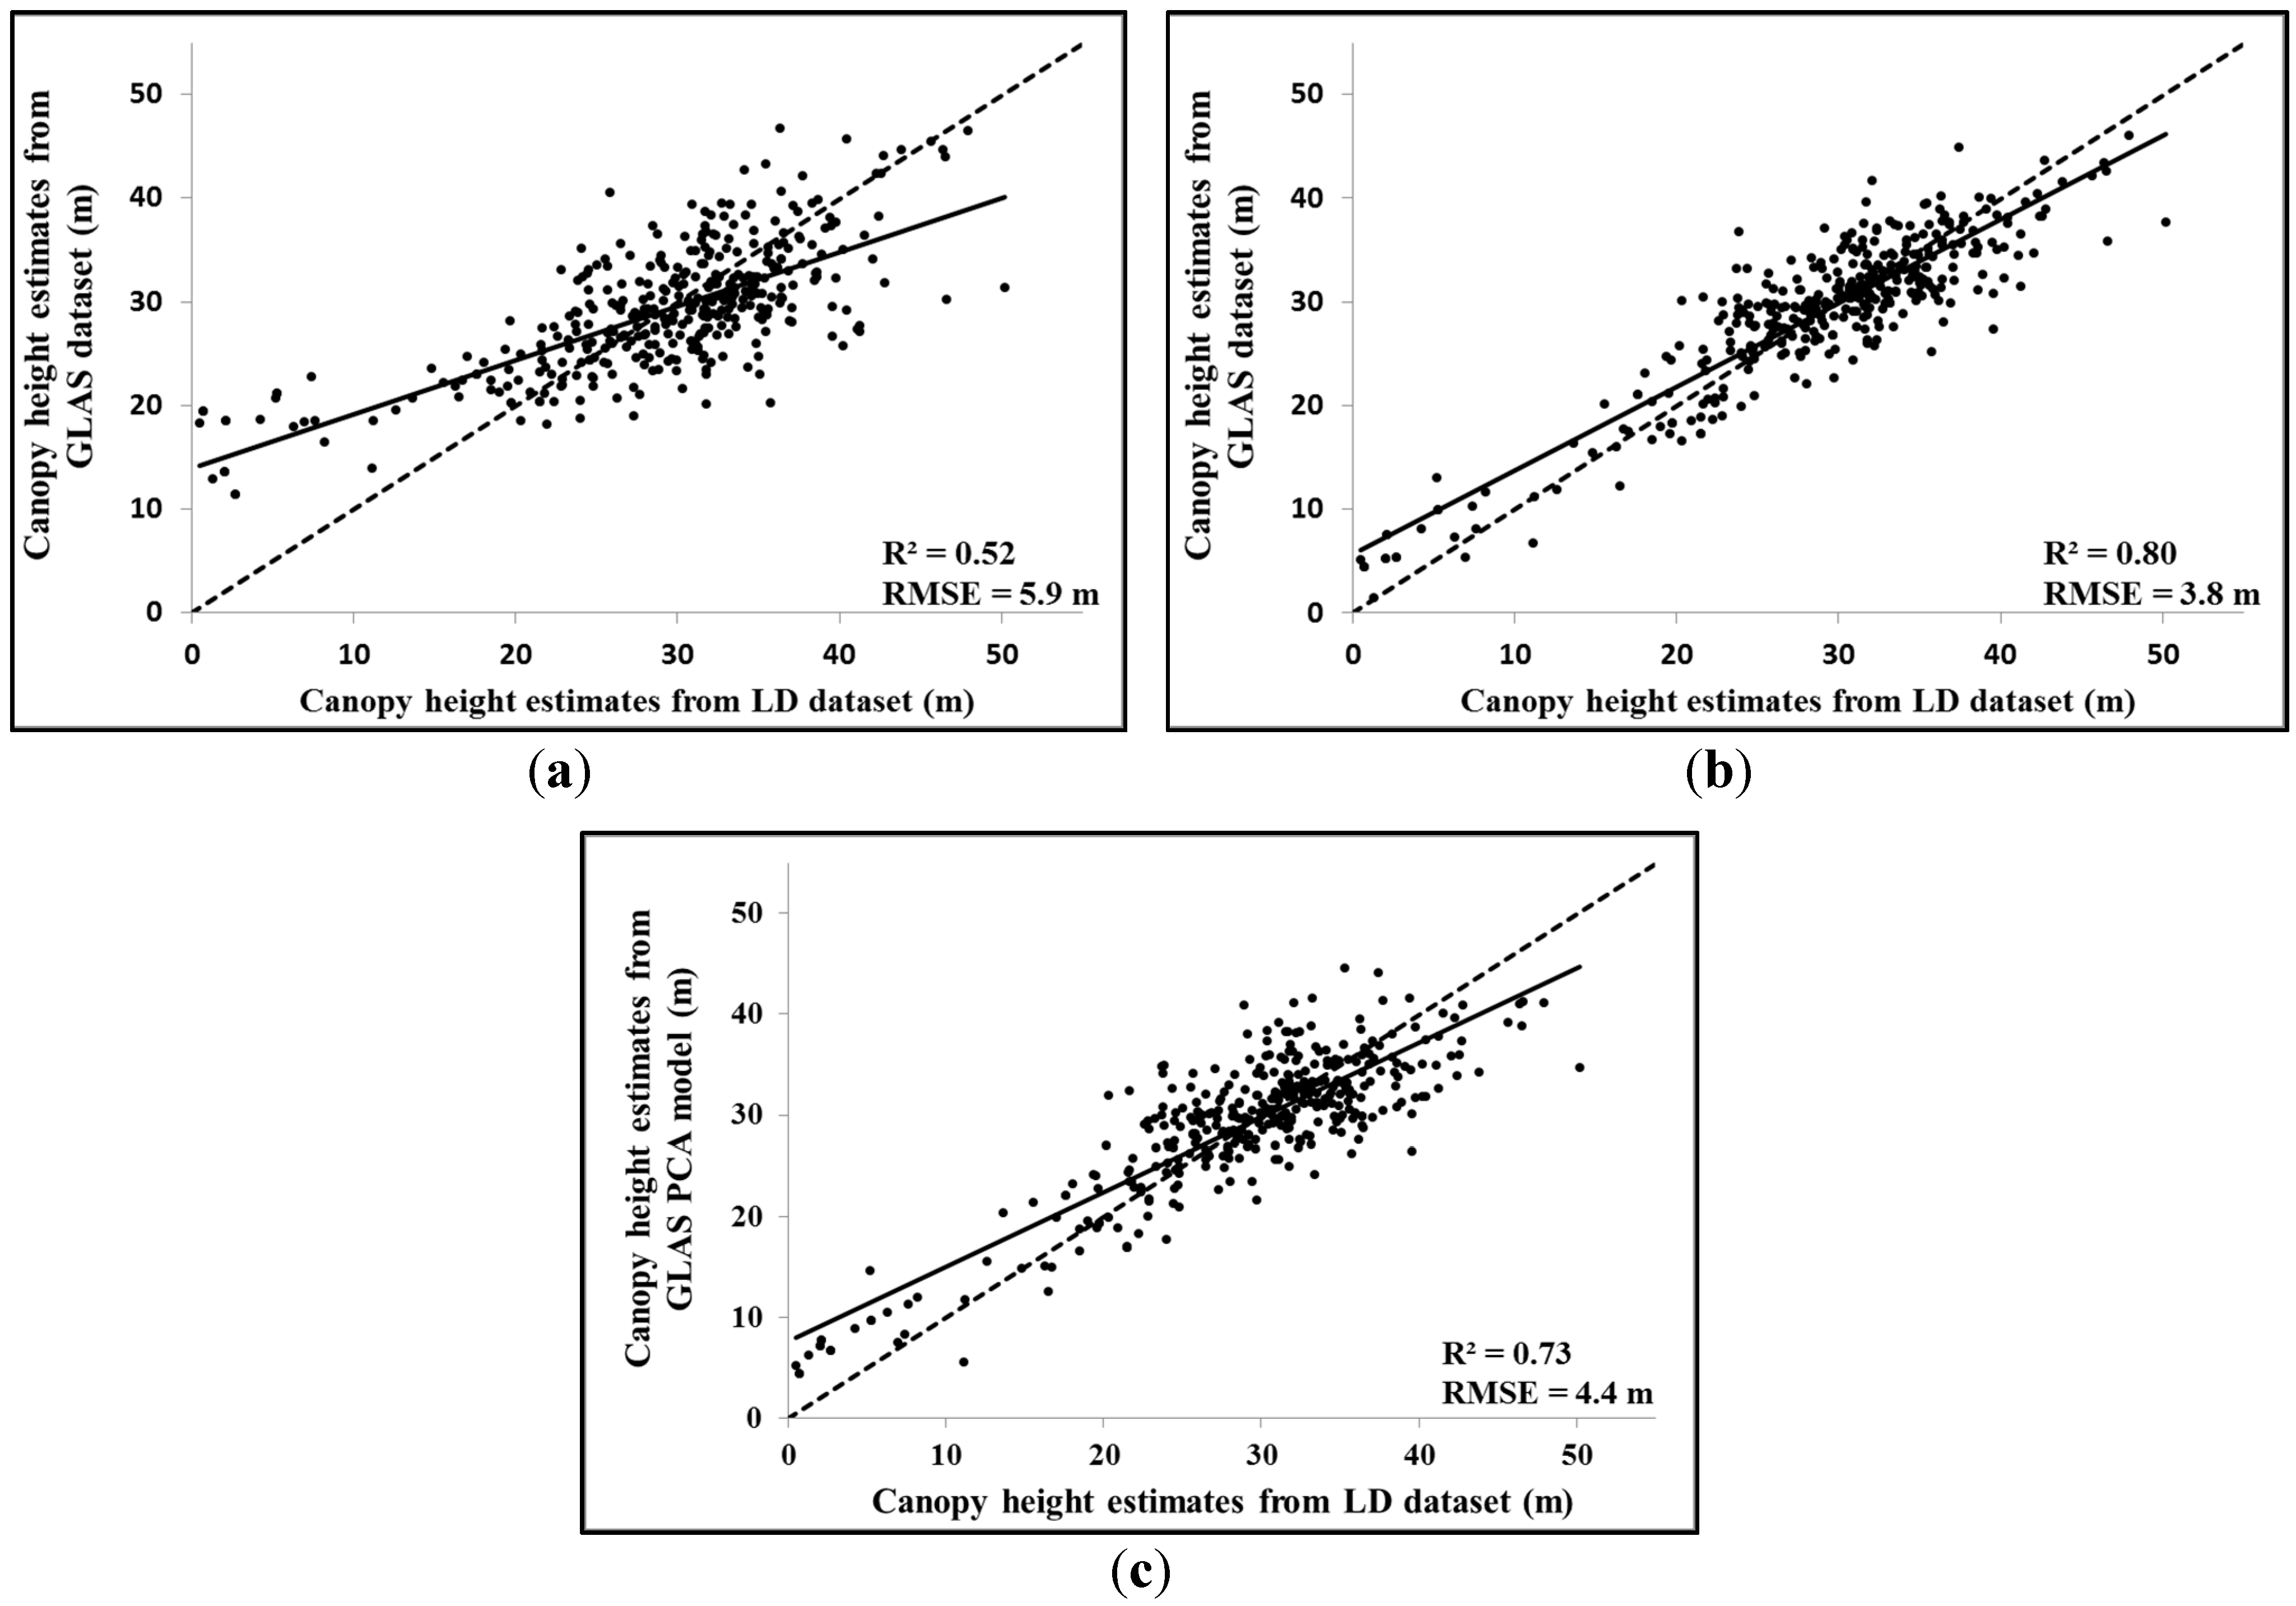
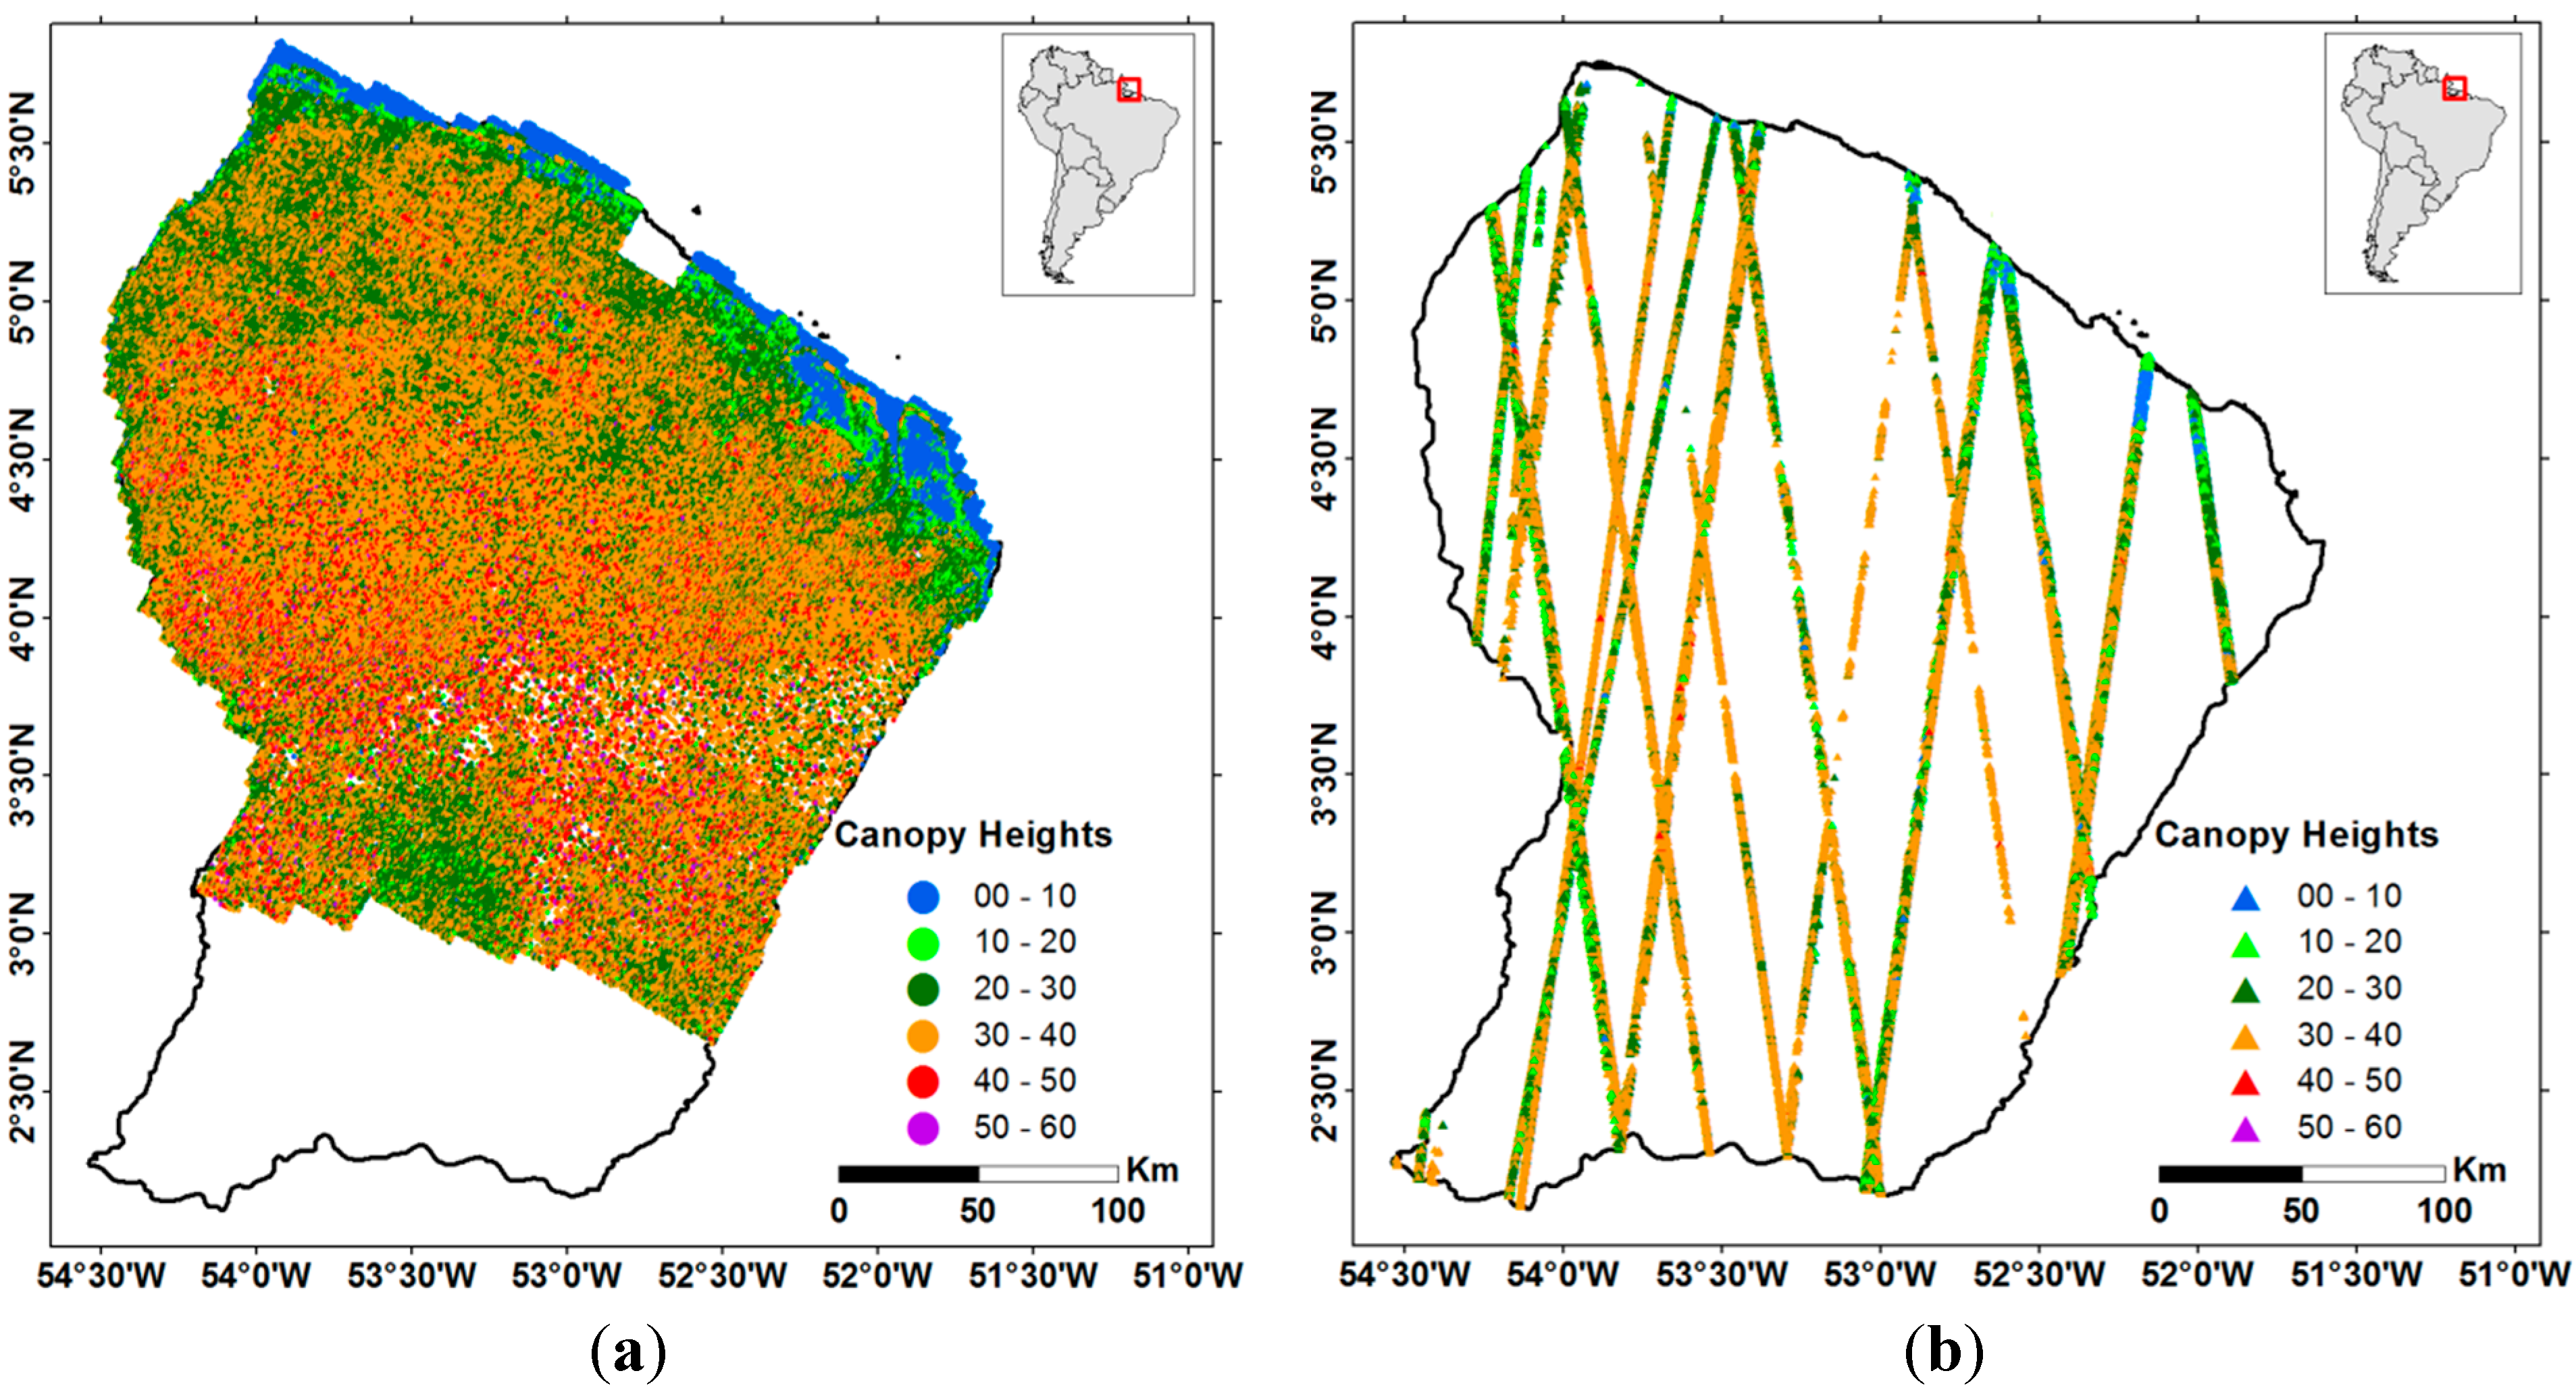
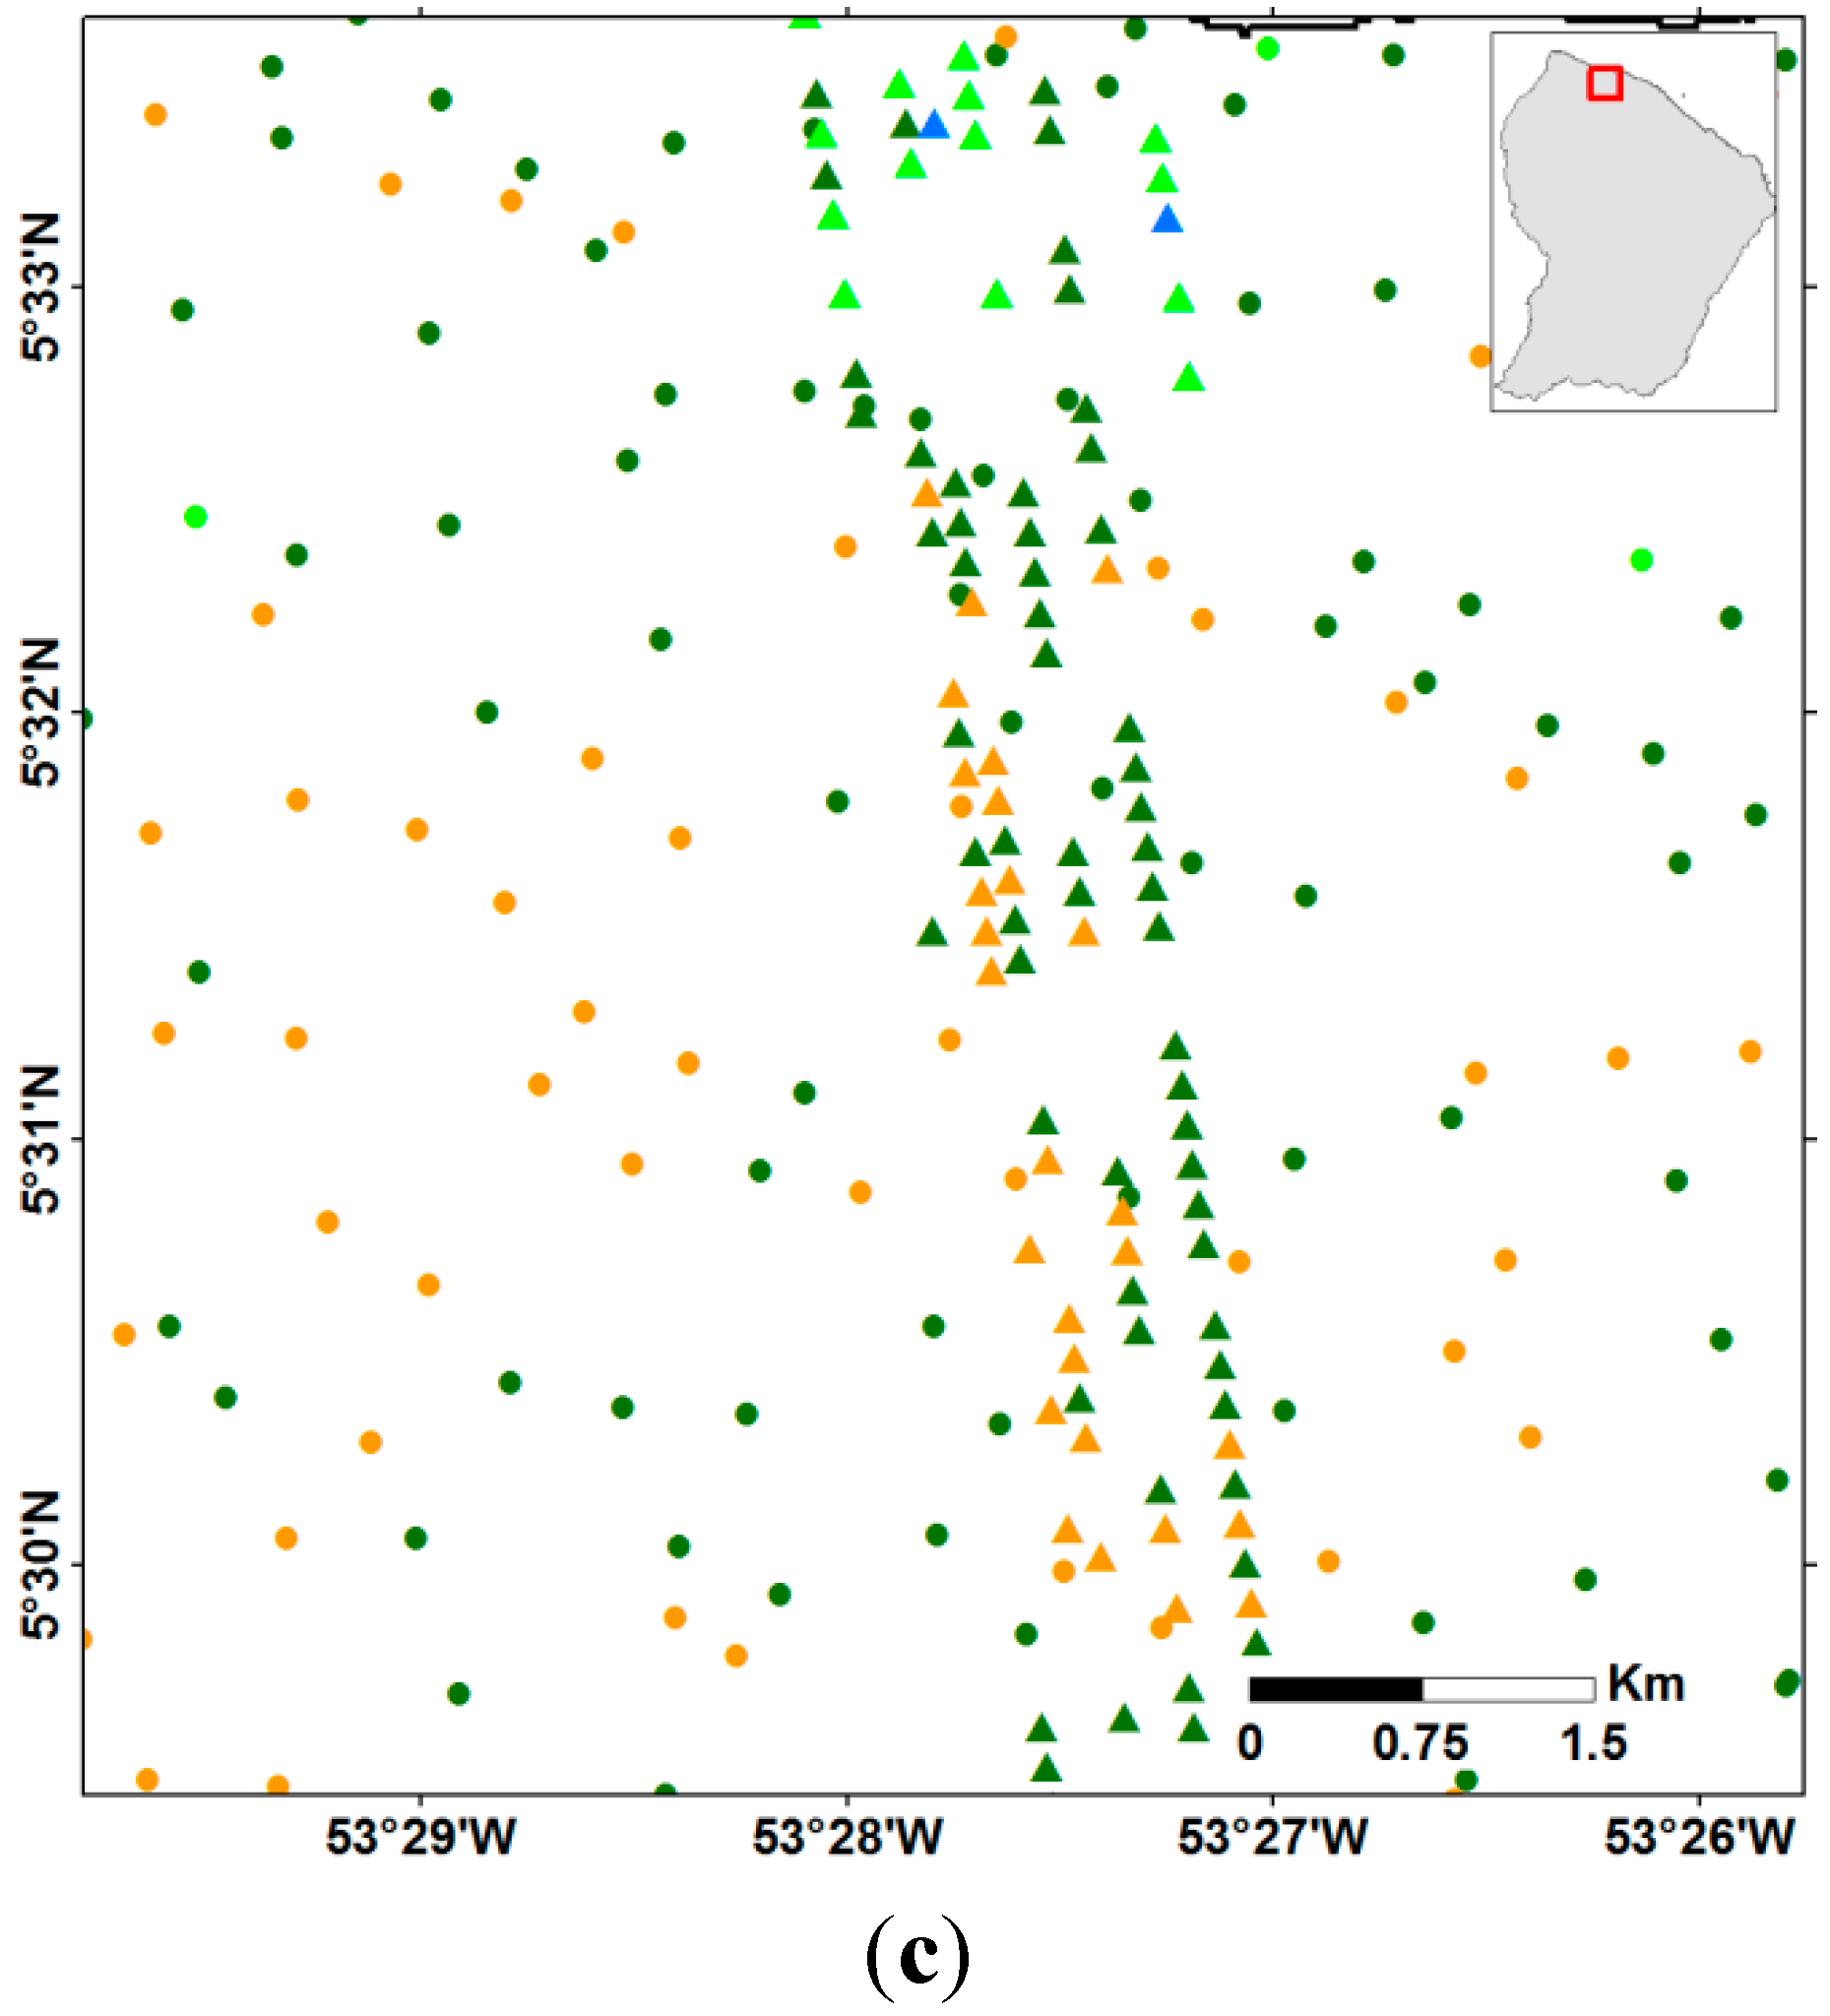
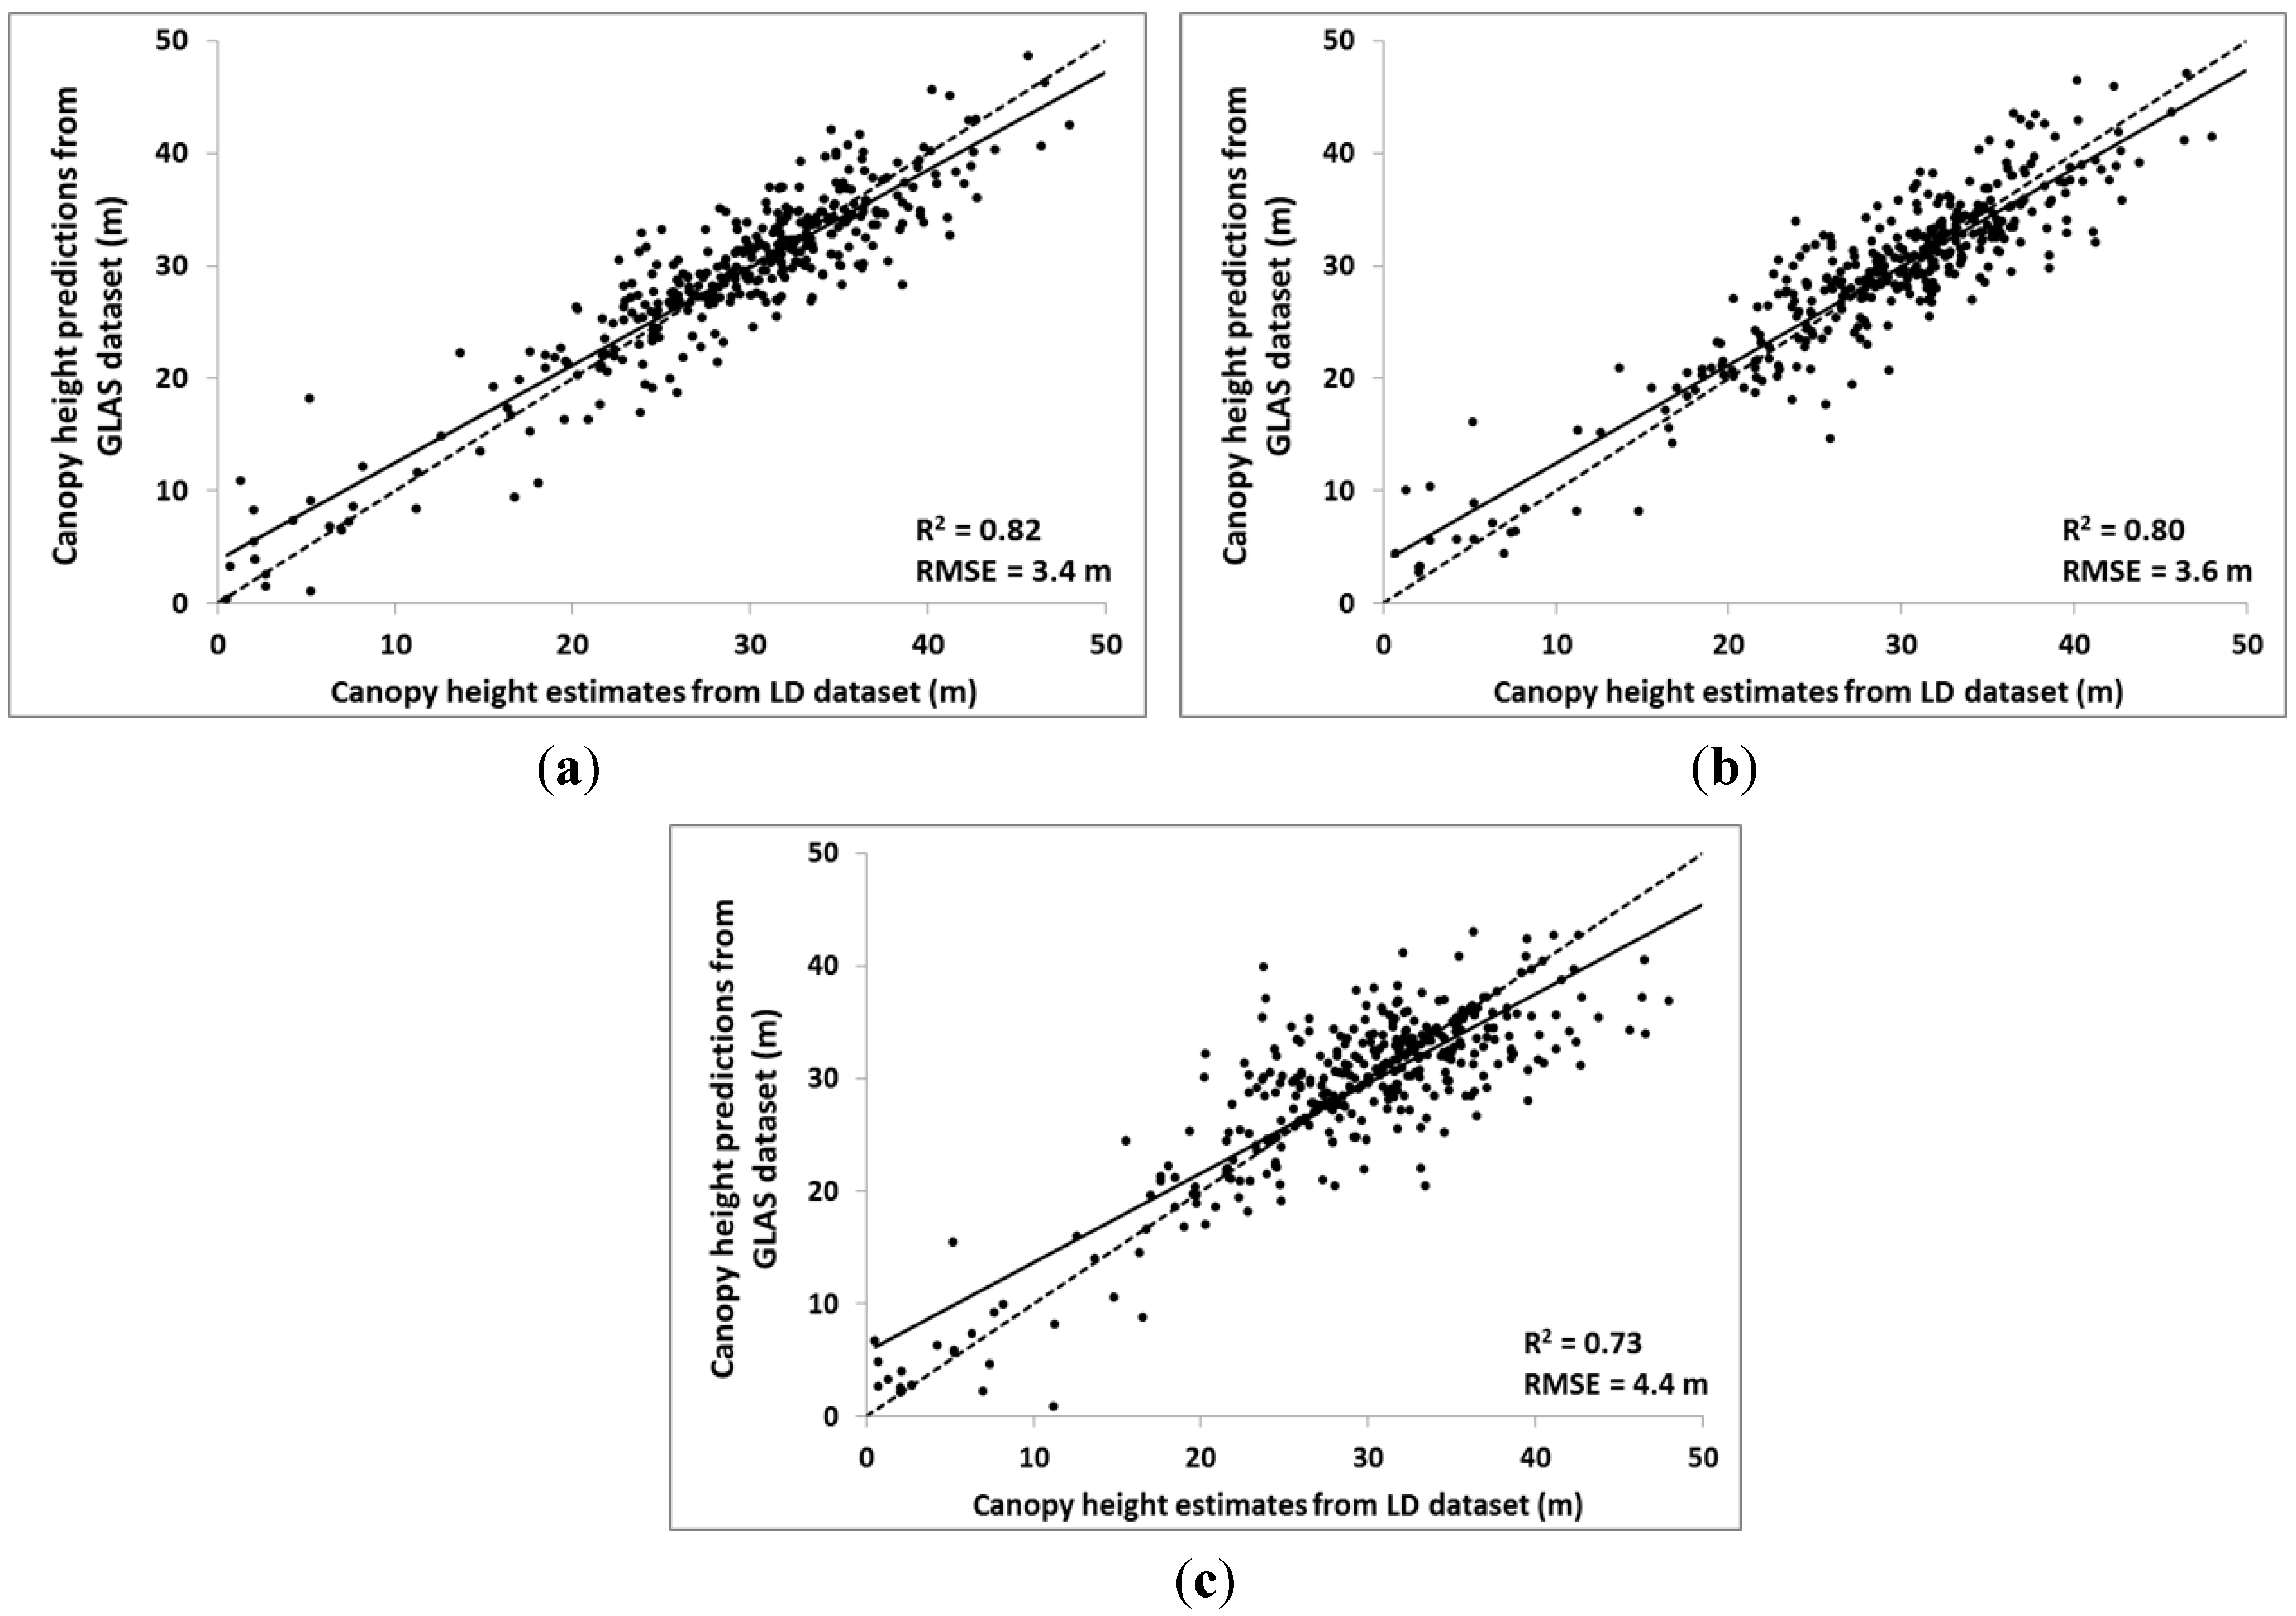
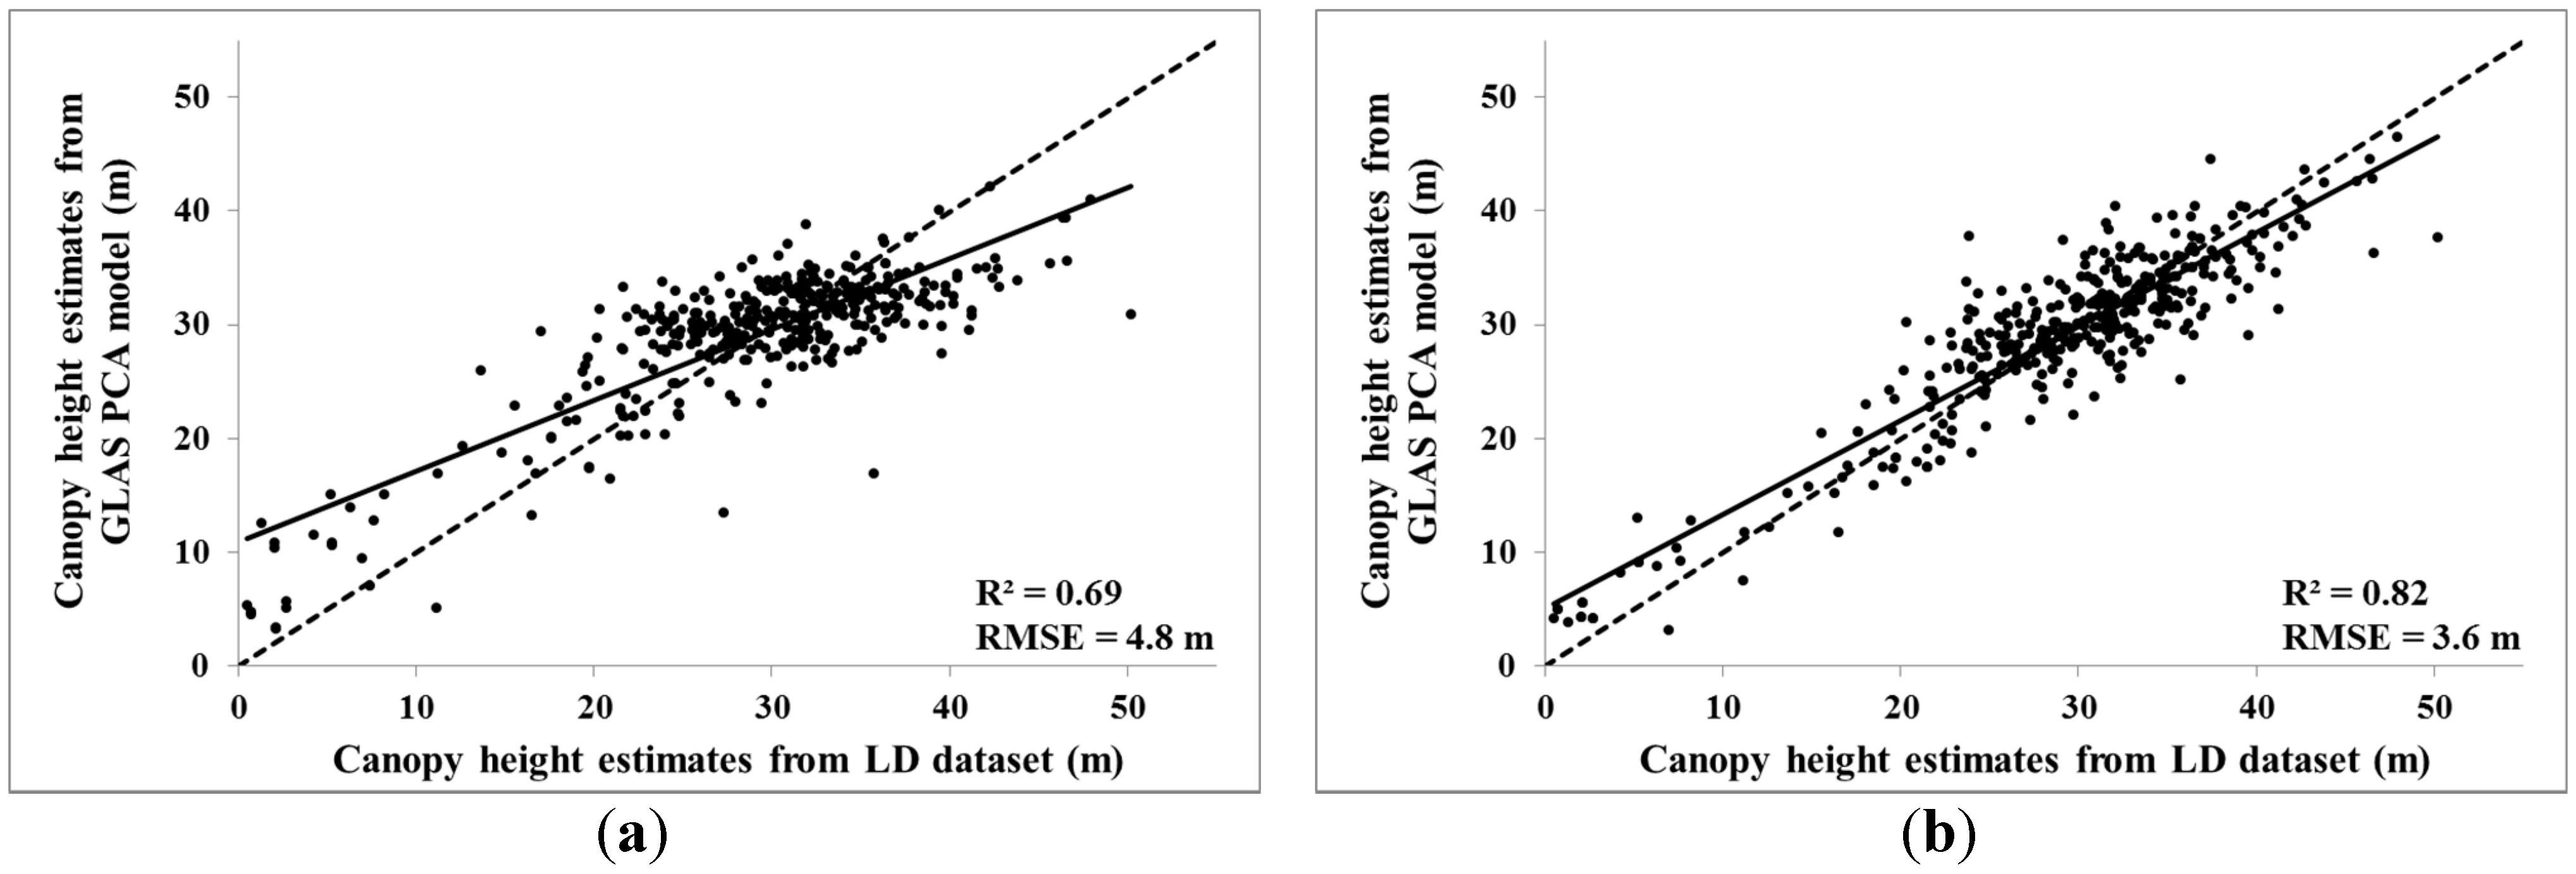
Estimating forest canopy height from large-footprint satellite LiDAR waveforms is challenging given the complex interaction between LiDAR waveforms, terrain, and vegetation, especially in dense tropical and equatorial forests. In this study, canopy height in French Guiana was estimated using multiple linear regression models and the Random Forest technique (RF). This analysis was either based on LiDAR waveform metrics extracted from the GLAS (Geoscience Laser Altimeter System) spaceborne LiDAR data and terrain information derived from the SRTM (Shuttle Radar Topography Mission) DEM (Digital Elevation Model) or on Principal Component Analysis (PCA) of GLAS waveforms. Results show that the best statistical model for estimating forest height based on waveform metrics and digital elevation data is a linear regression of waveform extent, trailing edge extent, and terrain index (RMSE of 3.7 m). For the PCA based models, better canopy height estimation results were observed using a regression model that incorporated both the first 13 principal components (PCs) and the waveform extent (RMSE = 3.8 m). Random Forest regressions revealed that the best configuration for canopy height estimation used all the following metrics: waveform extent, leading edge, trailing edge, and terrain index (RMSE = 3.4 m). Waveform extent was the variable that best explained canopy height, with an importance factor almost three times higher than those for the other three metrics (leading edge, trailing edge, and terrain index). Furthermore, the Random Forest regression incorporating the first 13 PCs and the waveform extent had a slightly-improved canopy height estimation in comparison to the linear model, with an RMSE of 3.6 m. In conclusion, multiple linear regressions and RF regressions provided canopy height estimations with similar precision using either LiDAR metrics or PCs. However, a regression model (linear regression or RF) based on the PCA of waveform samples with waveform extent information is an interesting alternative for canopy height estimation as it does not require several metrics that are difficult to derive from GLAS waveforms in dense forests, such as those in French Guiana. View Full-Text
Keywords: LiDAR; ICESat/GLAS; canopy height; tropical forest; French Guiana
▼ Figures
This is an open access article distributed under the Creative Commons Attribution License which permits unrestricted use, distribution, and reproduction in any medium, provided the original work is properly cited. (CC BY 4.0).
For further details log on website :
http://www.mdpi.com/2072-4292/6/12/11883


No comments:
Post a Comment