1
Department of Forest Resources, University of Minnesota, 1530 Cleveland Ave. N, St. Paul, MN 55108, USA
2
Earth Resources Observation and Science Center, US Geological Survey, Sioux Falls, SD 57198, USA
*
Author to whom correspondence should be addressed.
Received: 5 April 2013 / Revised: 20 June 2013 / Accepted: 20 June 2013 / Published: 4 July 2013
Abstract
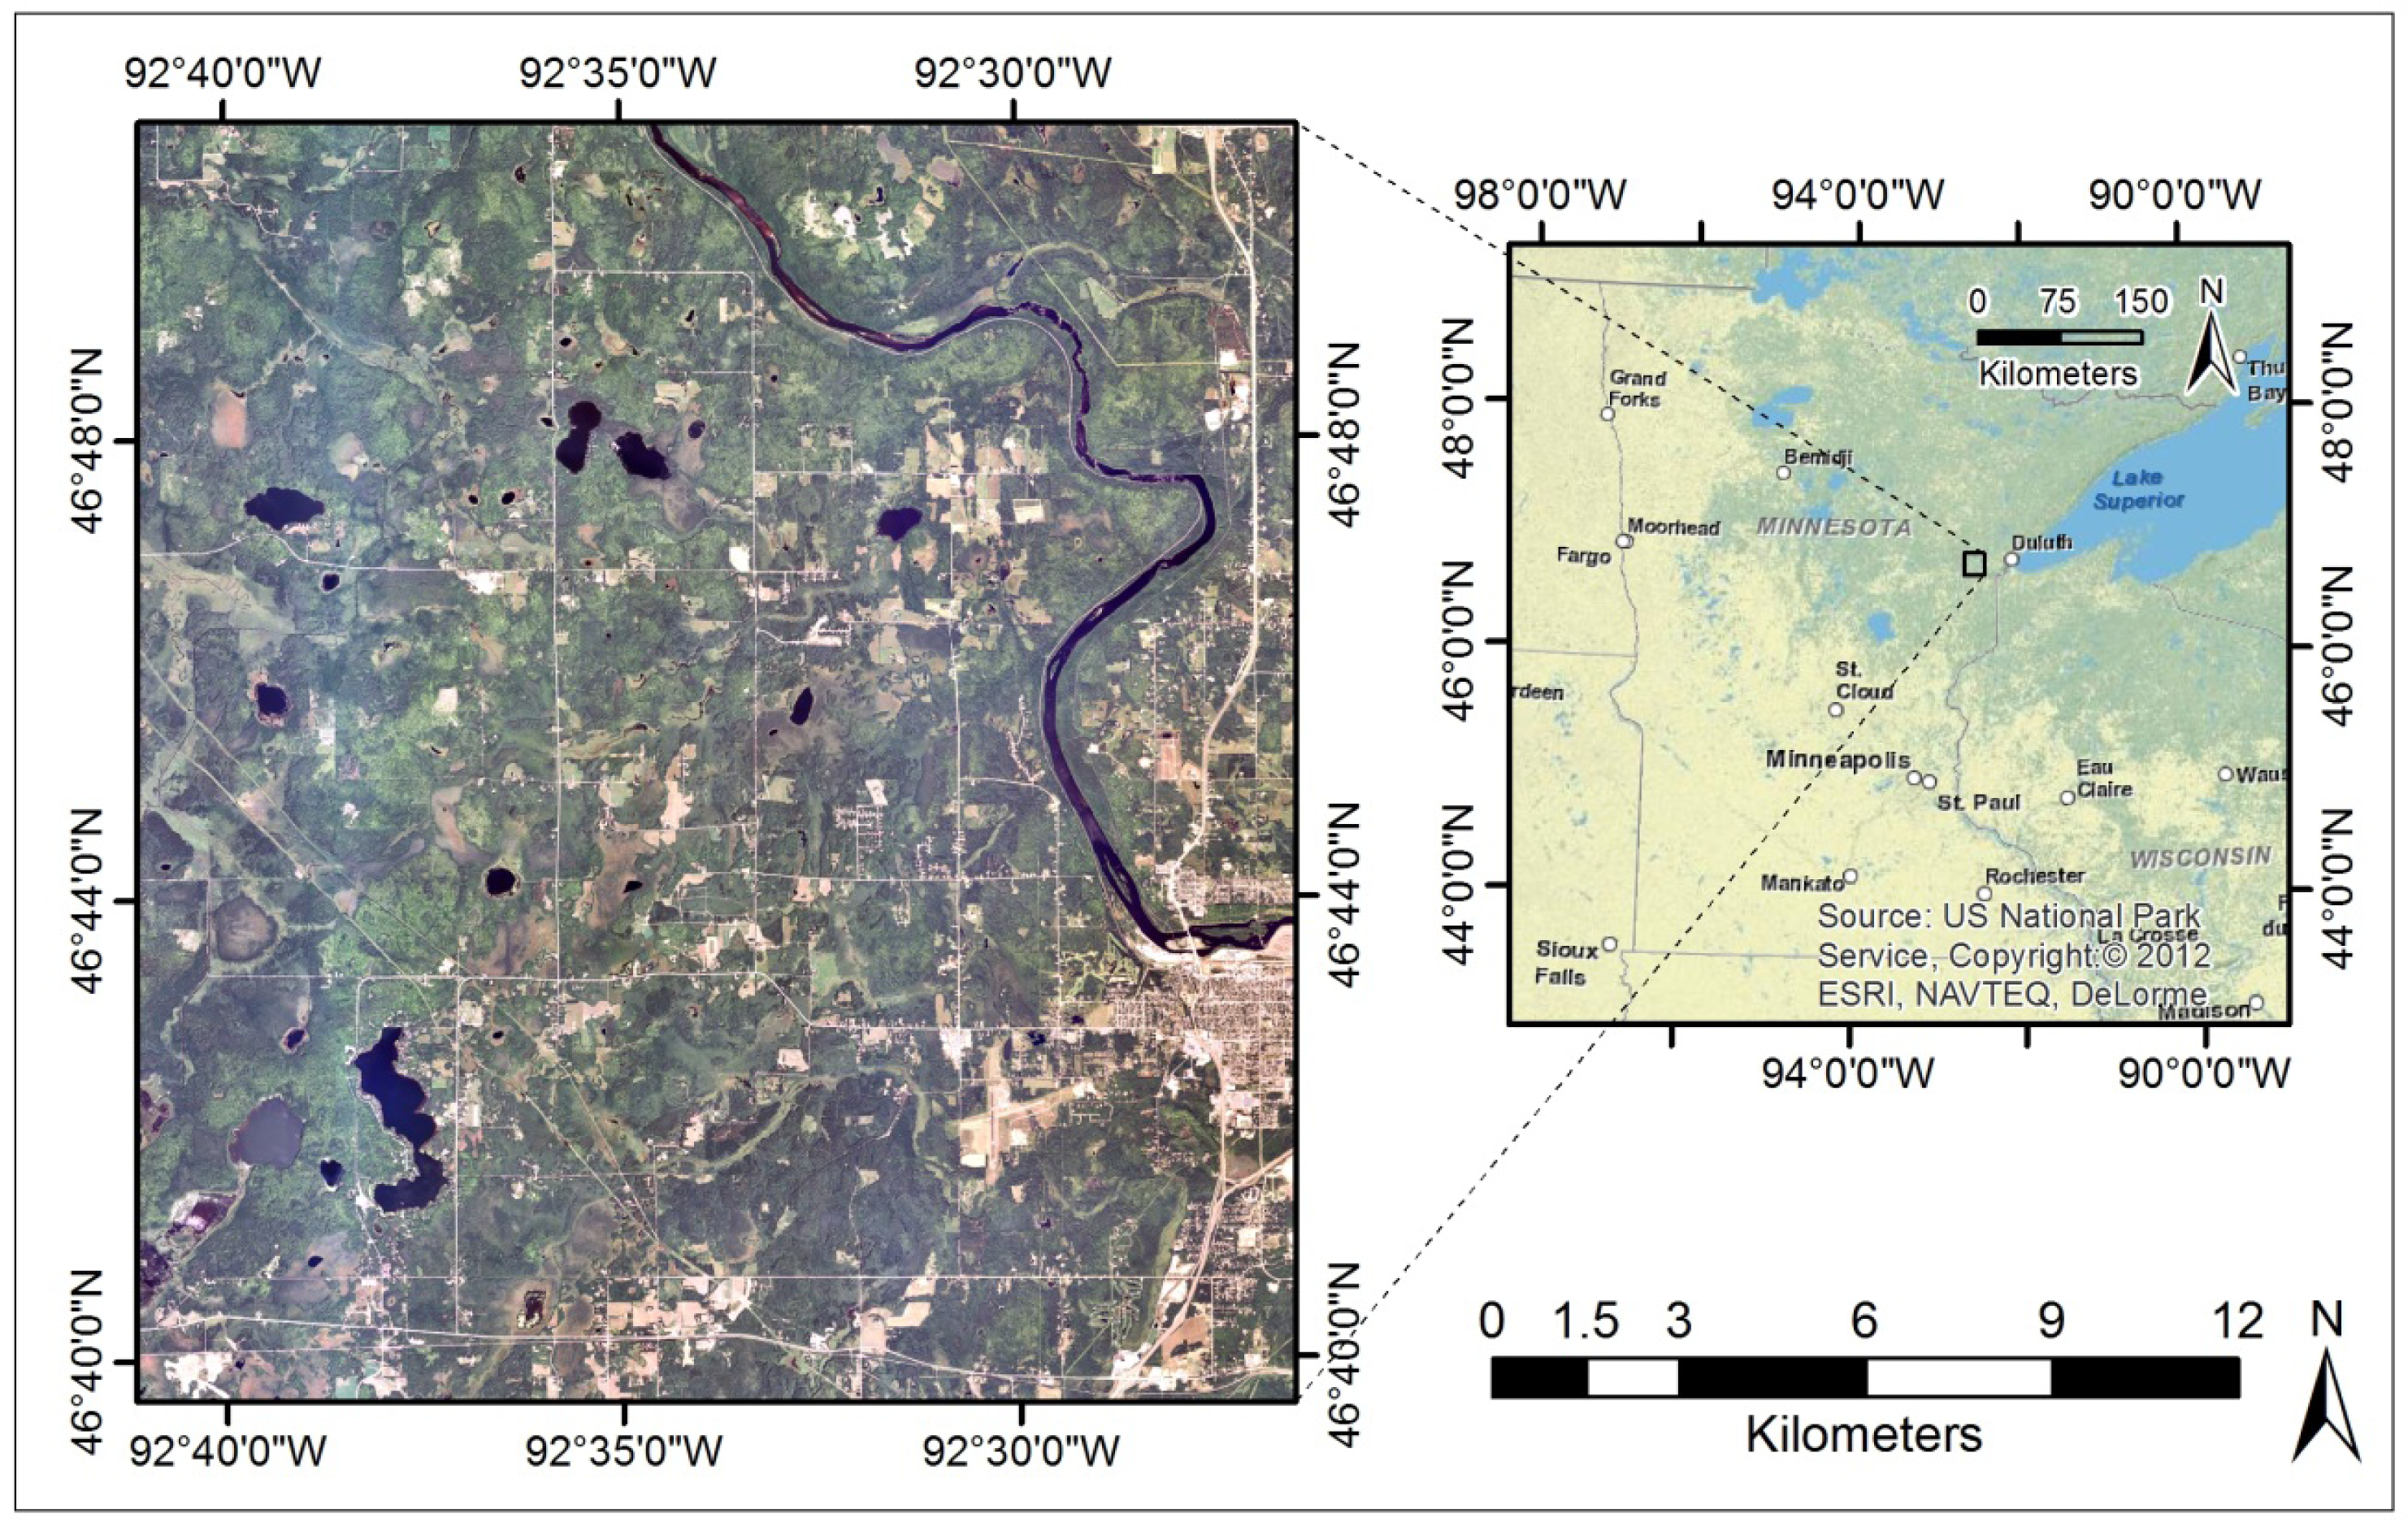
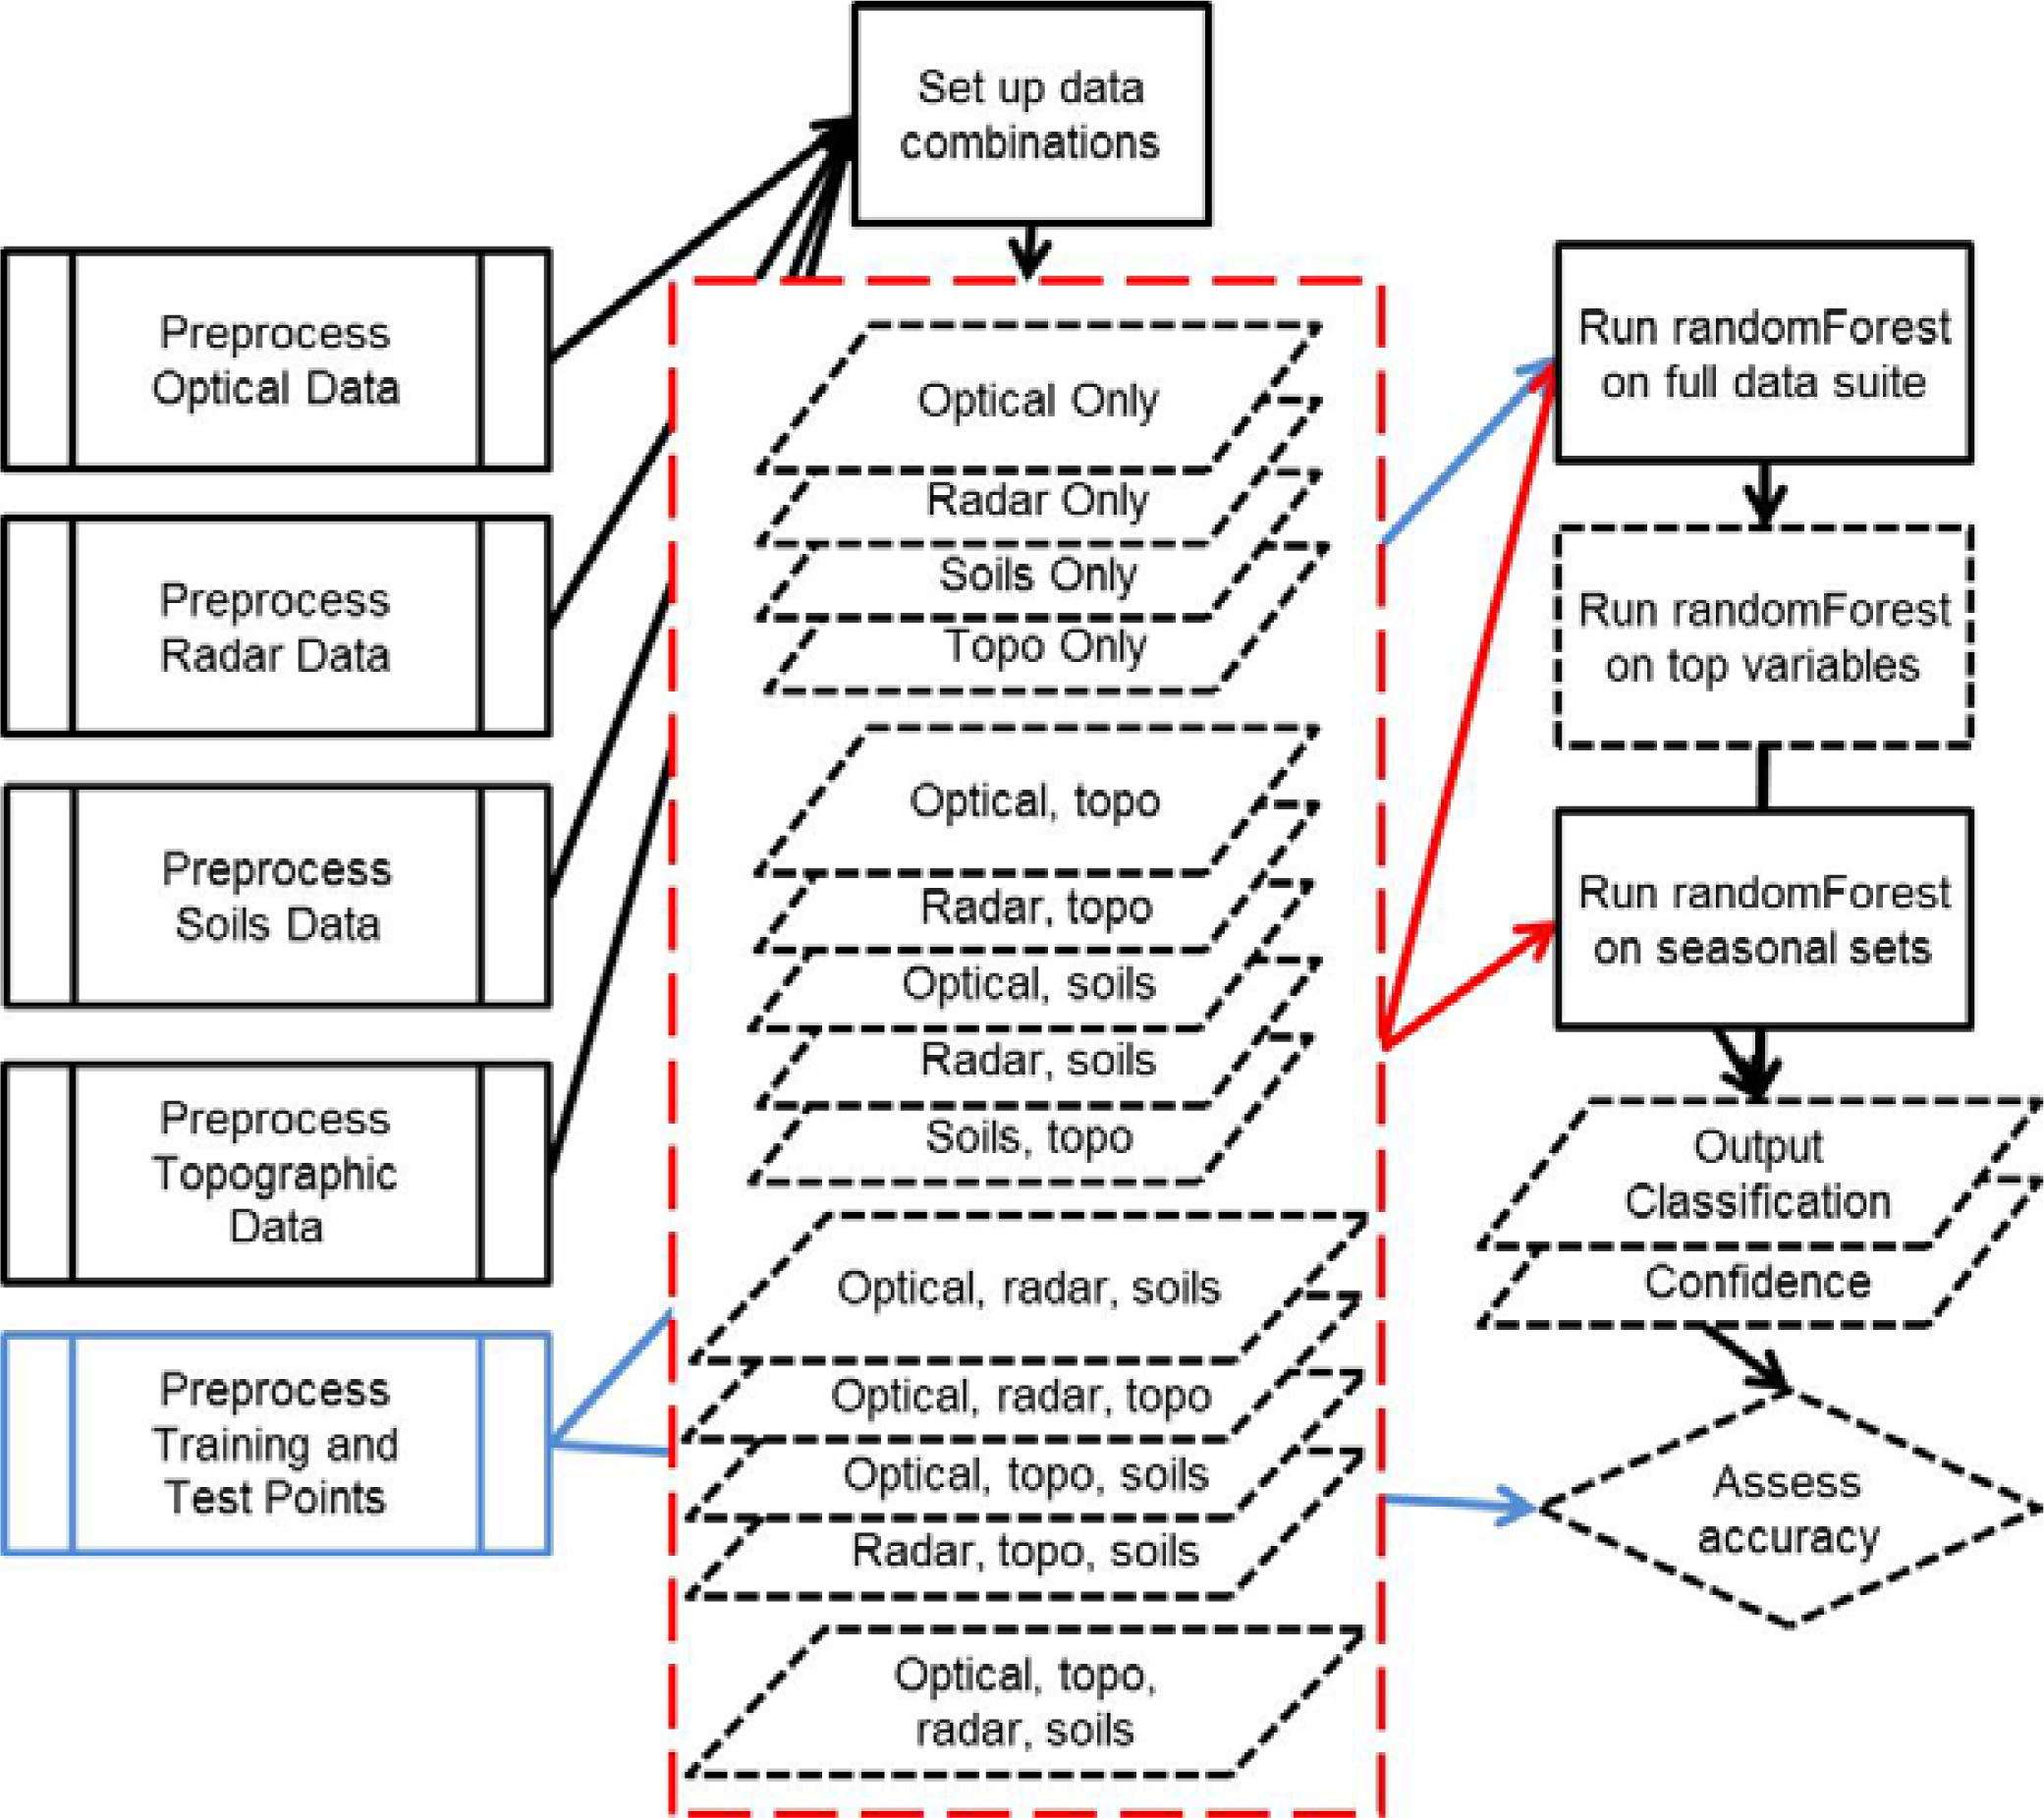
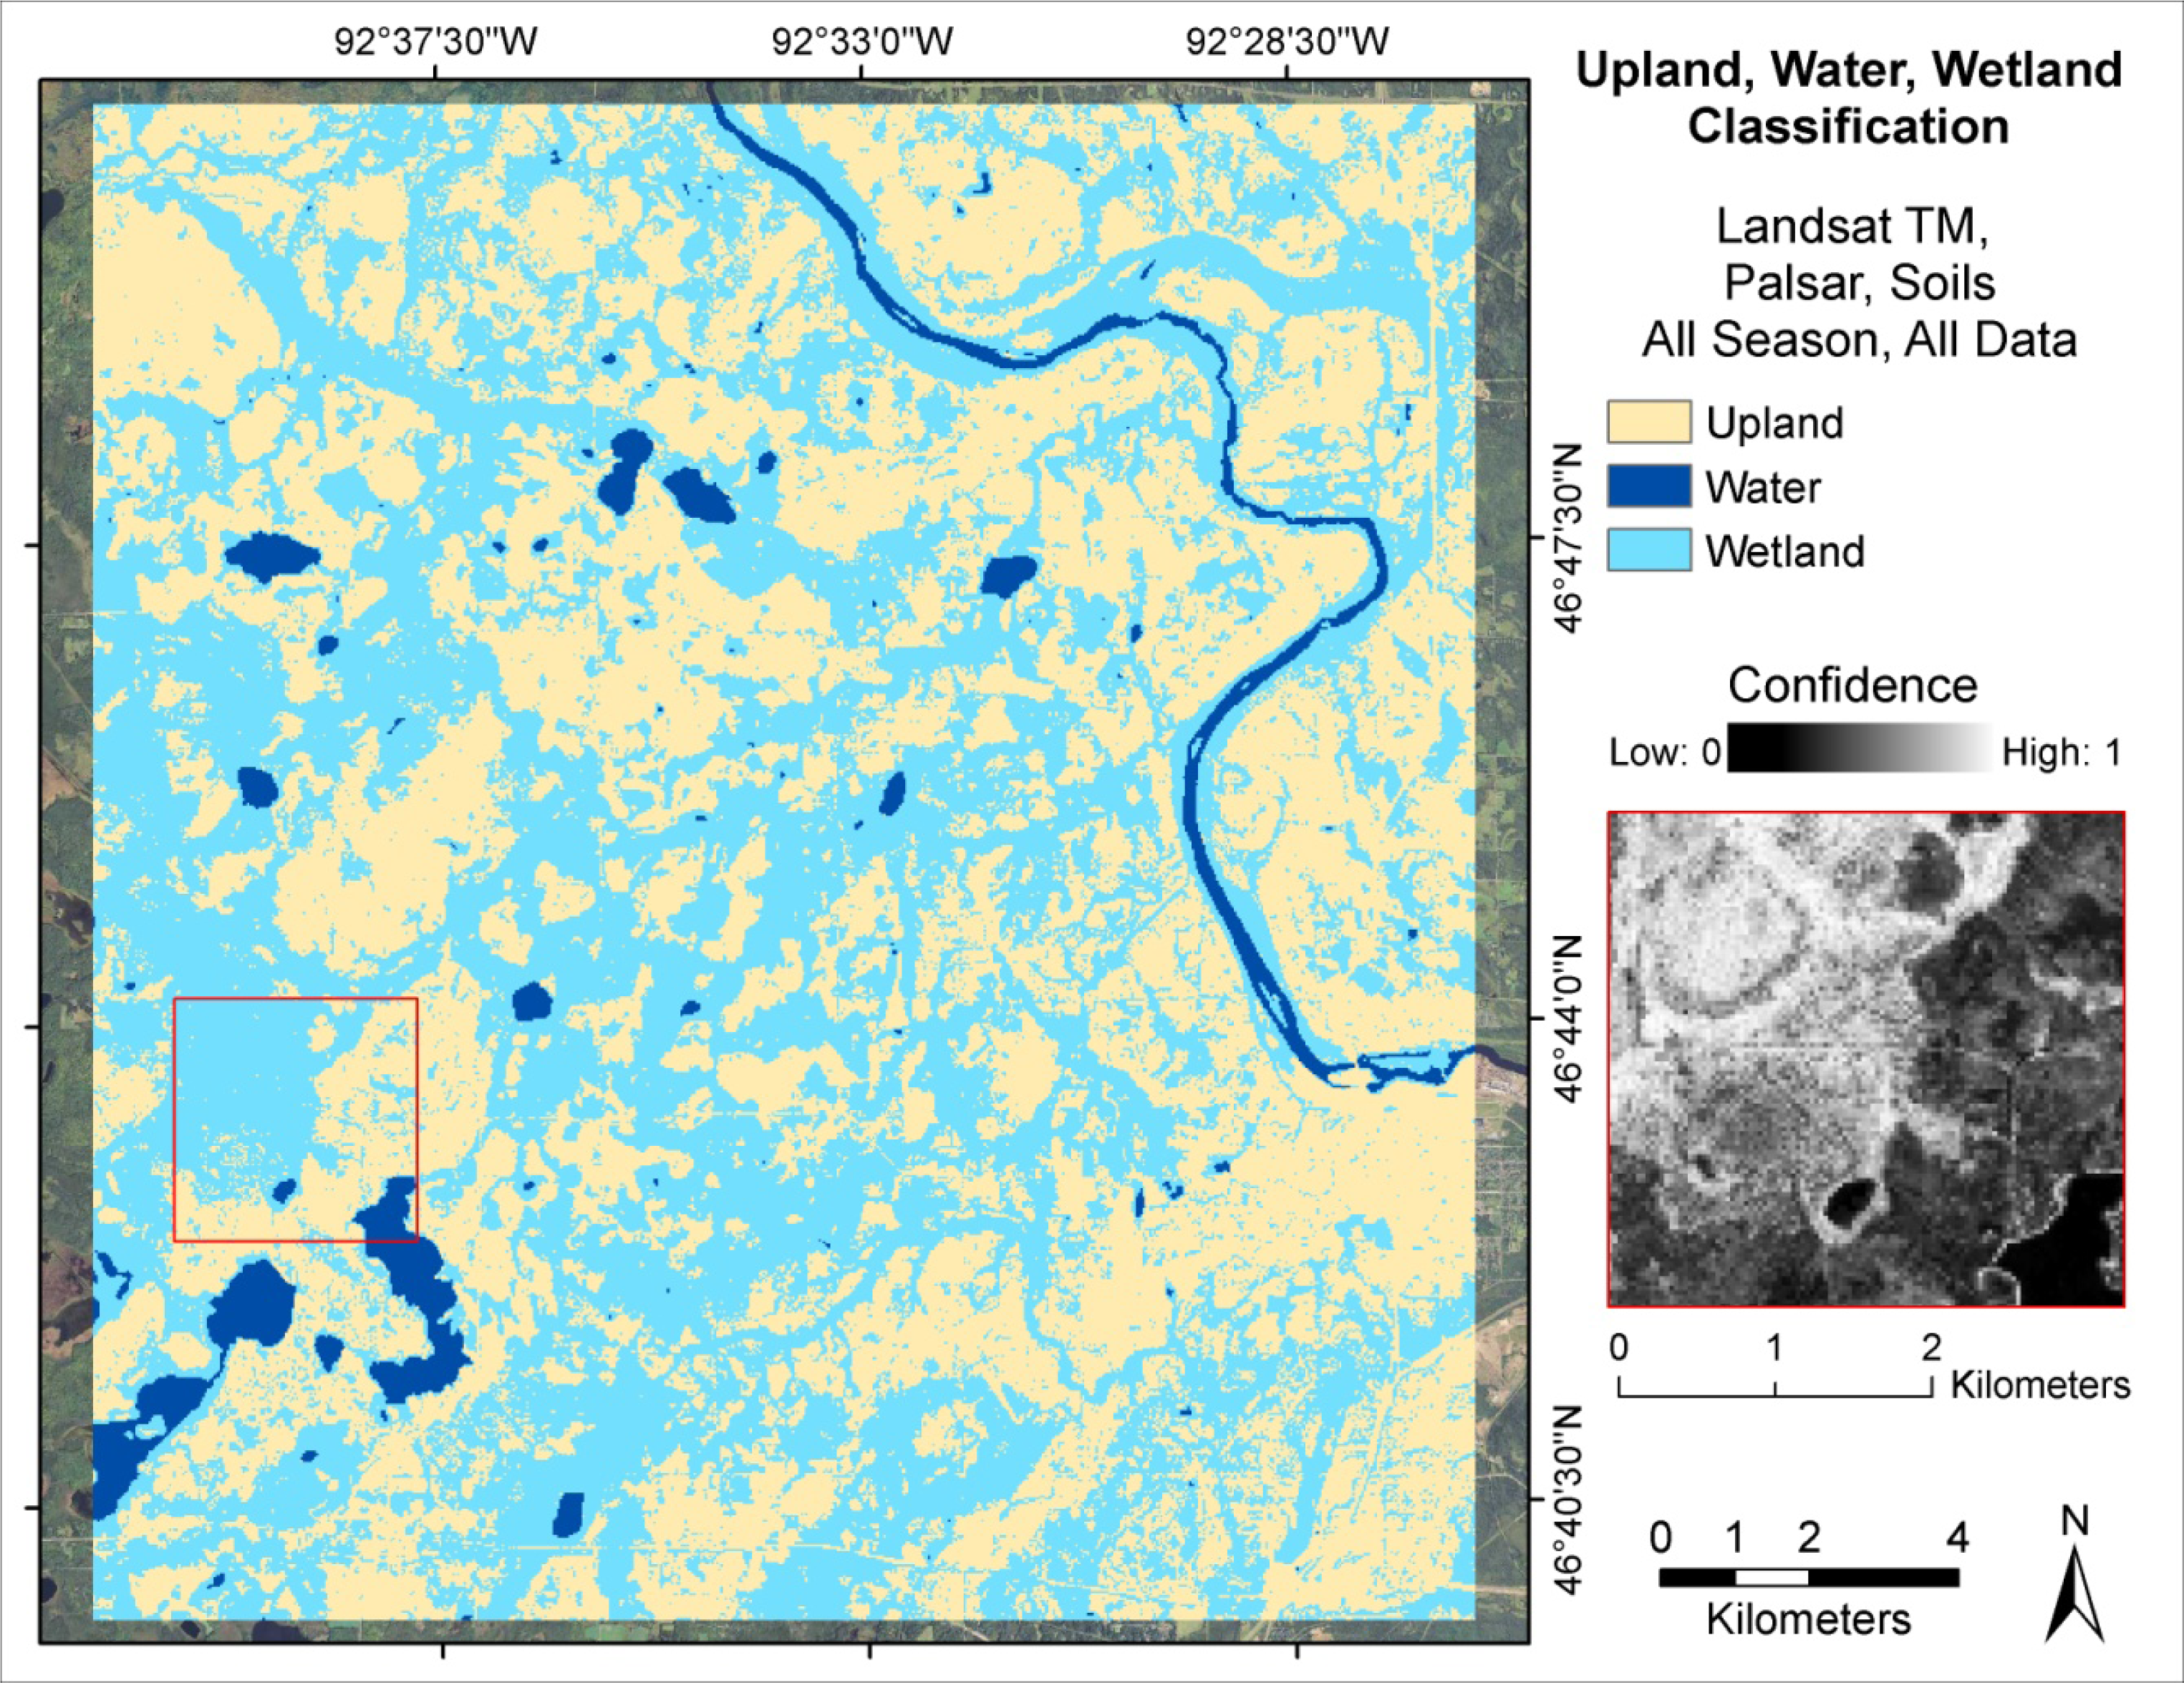
Wetland mapping at the landscape scale using remotely sensed data requires both affordable data and an efficient accurate classification method. Random forest classification offers several advantages over traditional land cover classification techniques, including a bootstrapping technique to generate robust estimations of outliers in the training data, as well as the capability of measuring classification confidence. Though the random forest classifier can generate complex decision trees with a multitude of input data and still not run a high risk of over fitting, there is a great need to reduce computational and operational costs by including only key input data sets without sacrificing a significant level of accuracy. Our main questions for this study site in Northern Minnesota were: (1) how does classification accuracy and confidence of mapping wetlands compare using different remote sensing platforms and sets of input data; (2) what are the key input variables for accurate differentiation of upland, water, and wetlands, including wetland type; and (3) which datasets and seasonal imagery yield the best accuracy for wetland classification. Our results show the key input variables include terrain (elevation and curvature) and soils descriptors (hydric), along with an assortment of remotely sensed data collected in the spring (satellite visible, near infrared, and thermal bands; satellite normalized vegetation index and Tasseled Cap greenness and wetness; and horizontal-horizontal (HH) and horizontal-vertical (HV) polarization using L-band satellite radar). We undertook this exploratory analysis to inform decisions by natural resource managers charged with monitoring wetland ecosystems and to aid in designing a system for consistent operational mapping of wetlands across landscapes similar to those found in Northern Minnesota. View Full-Text
Keywords: wetland; classification; data integration; decision tree; random forest
This is an open access article distributed under the Creative Commons Attribution License (CC BY 3.0).
For further details log on website :
http://www.mdpi.com/2072-4292/5/7/3212


No comments:
Post a Comment