1
Faculty of Forestry and Wood Sciences, Czech University of Life Sciences Prague, Kamýcká 129, Praha 165 21, Czech Republic
2
Faculty of Forest Forestry, Gorgan University of Agriculture and Natural Resources, Basij Square, 386 Gorgan, Iran
*
Author to whom correspondence should be addressed.
Academic Editors: Rodney J. Keenan and Timothy A. Martin
Received: 9 November 2016 / Revised: 7 February 2017 / Accepted: 10 February 2017 / Published: 14 February 2017
Abstract
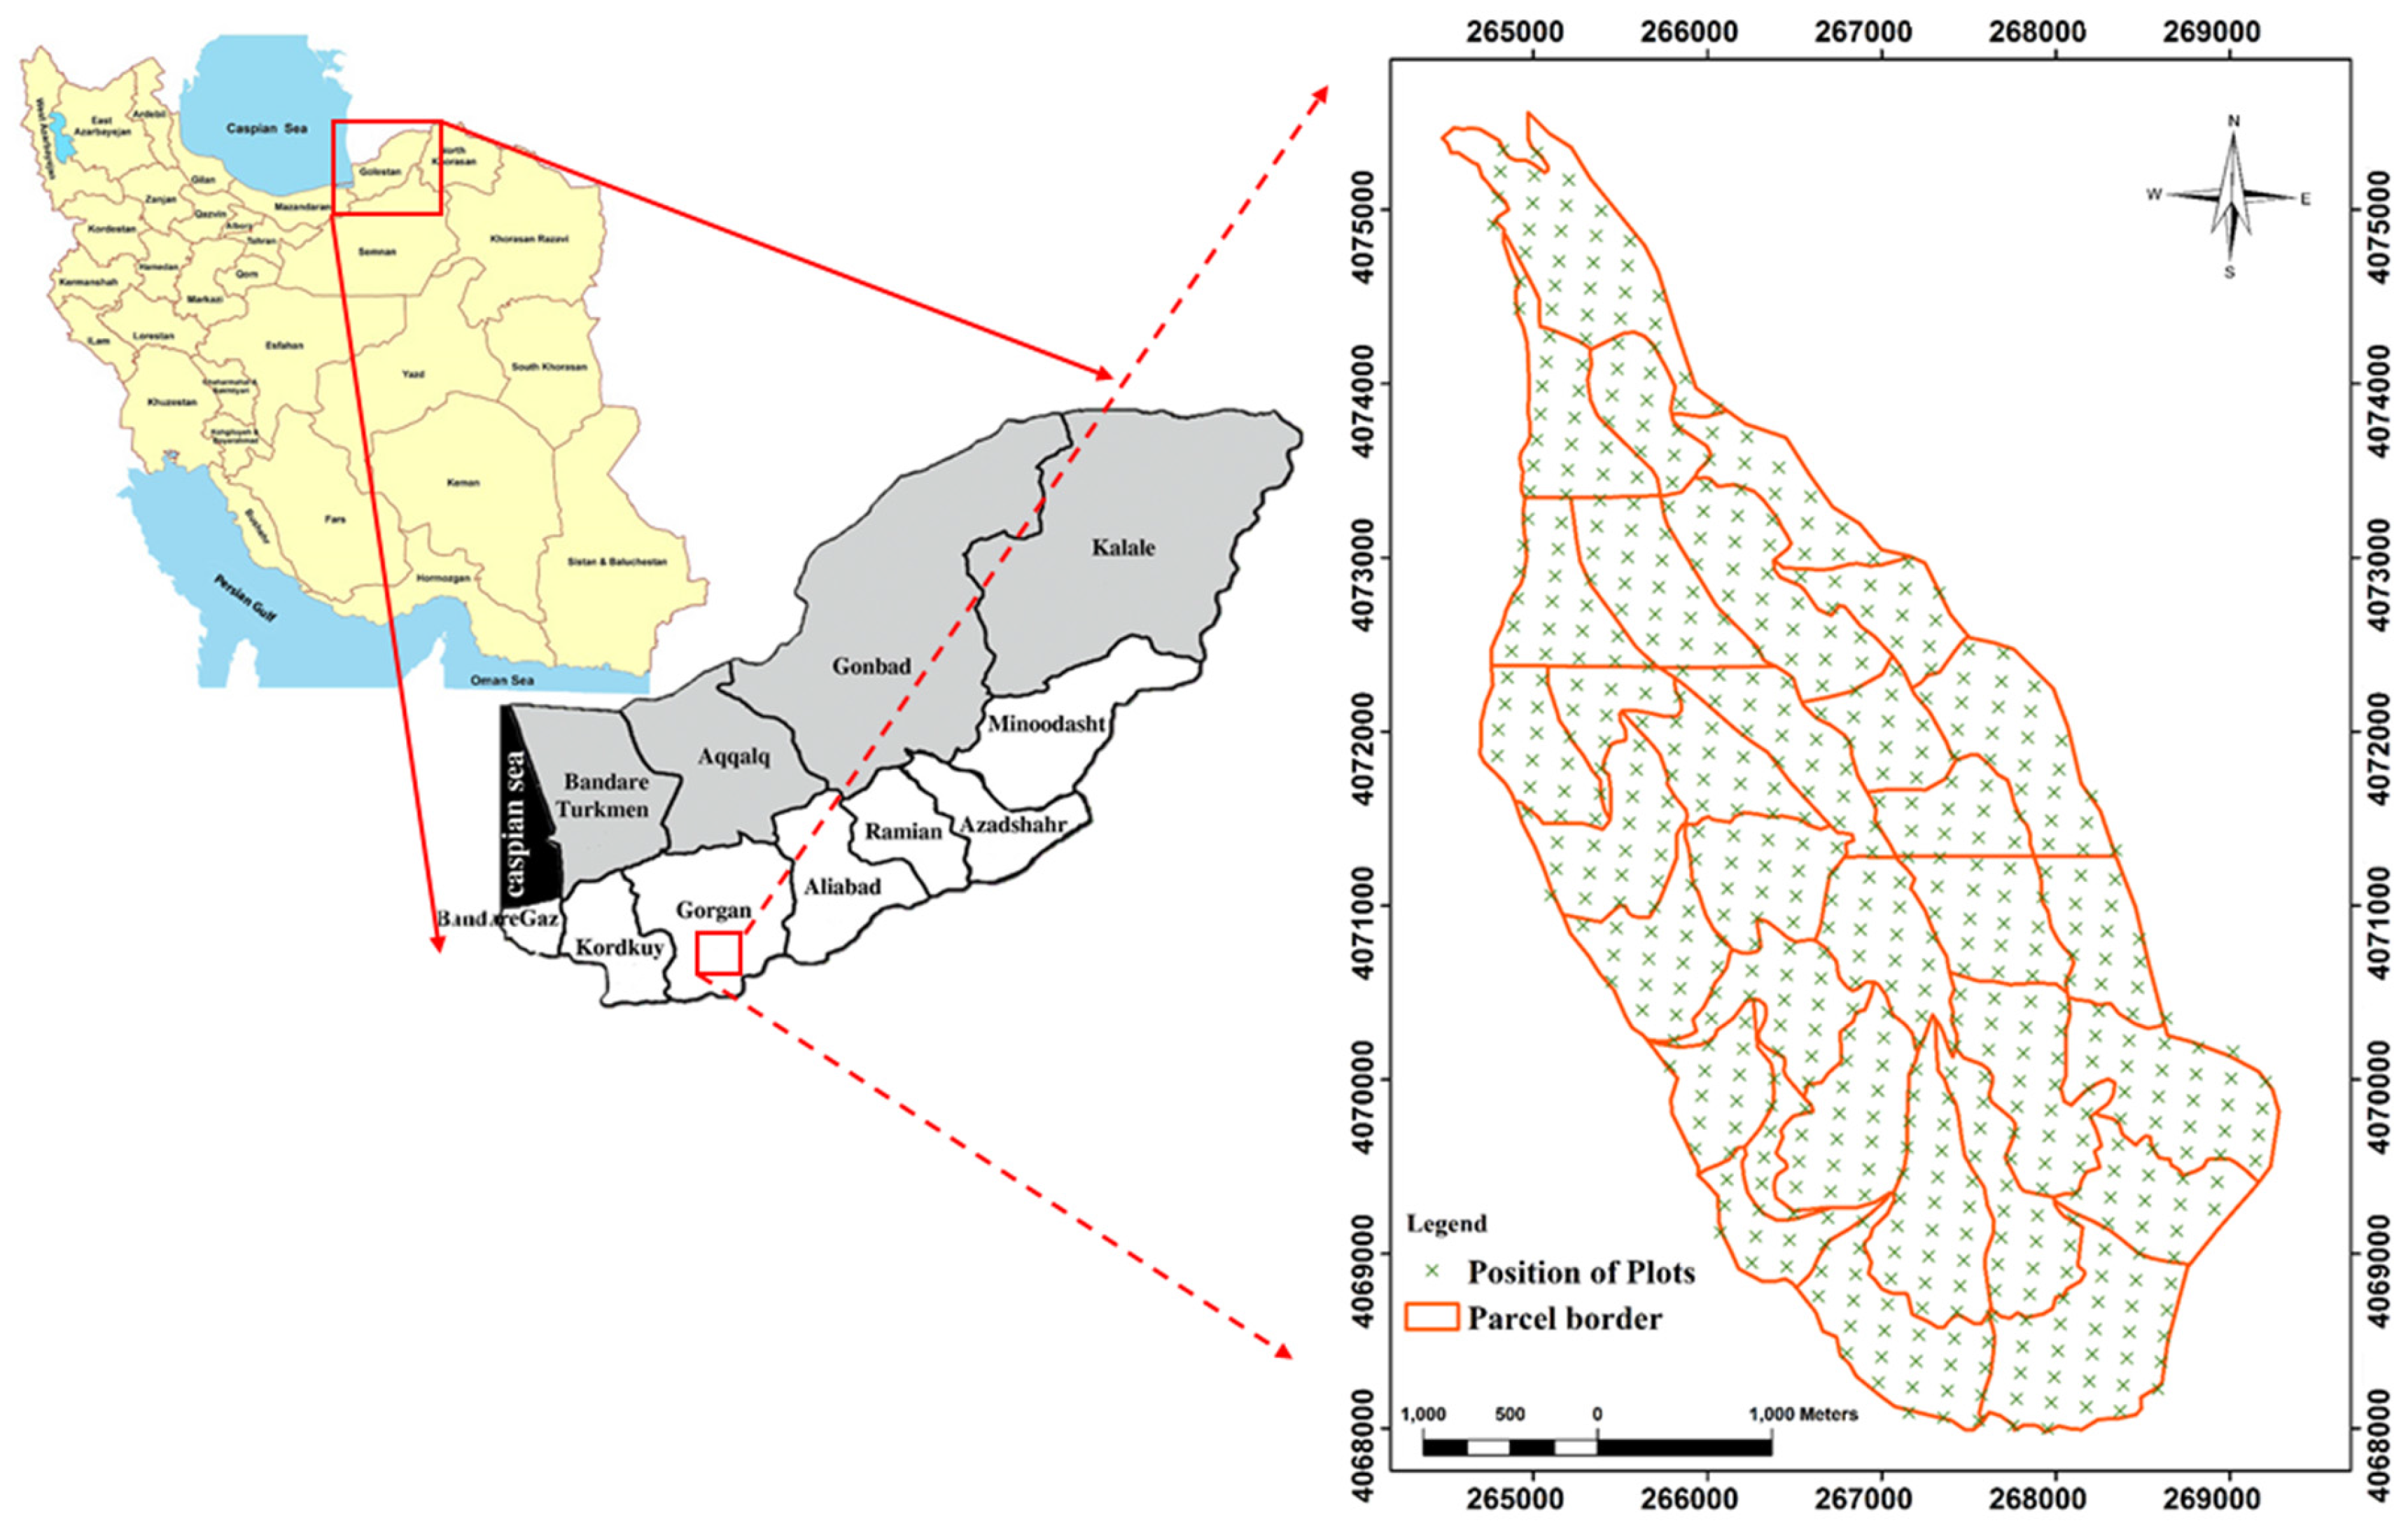
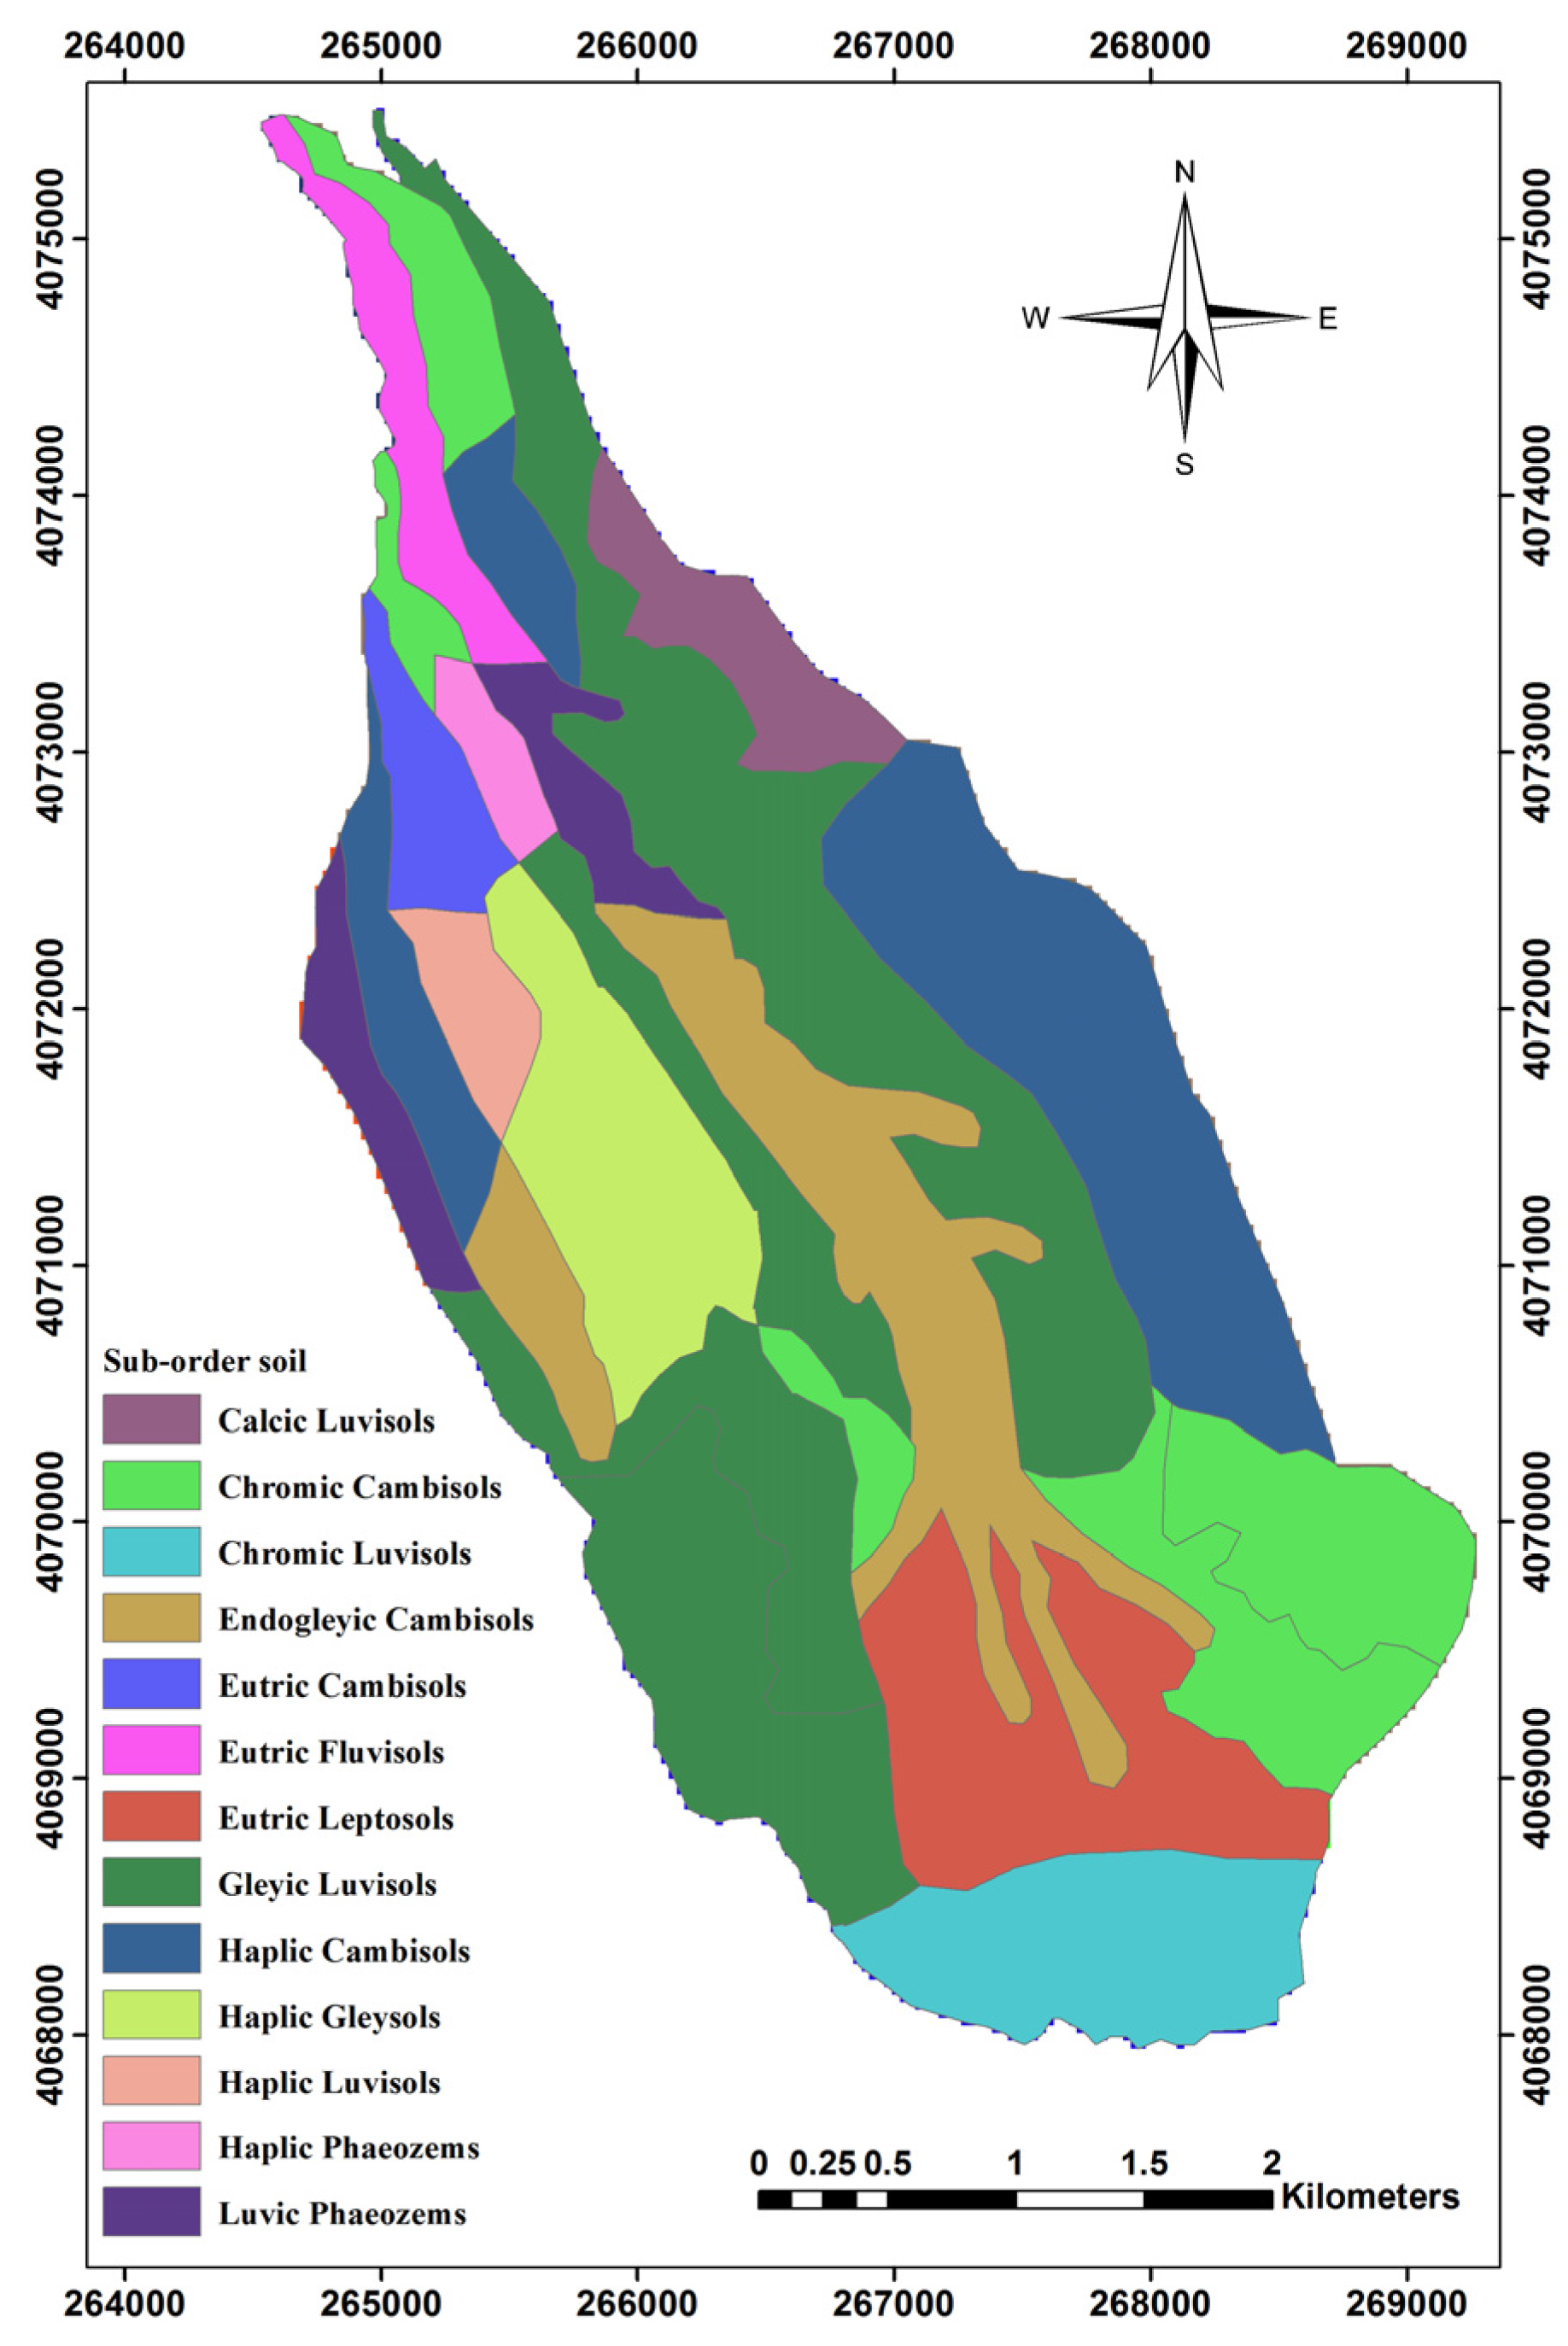
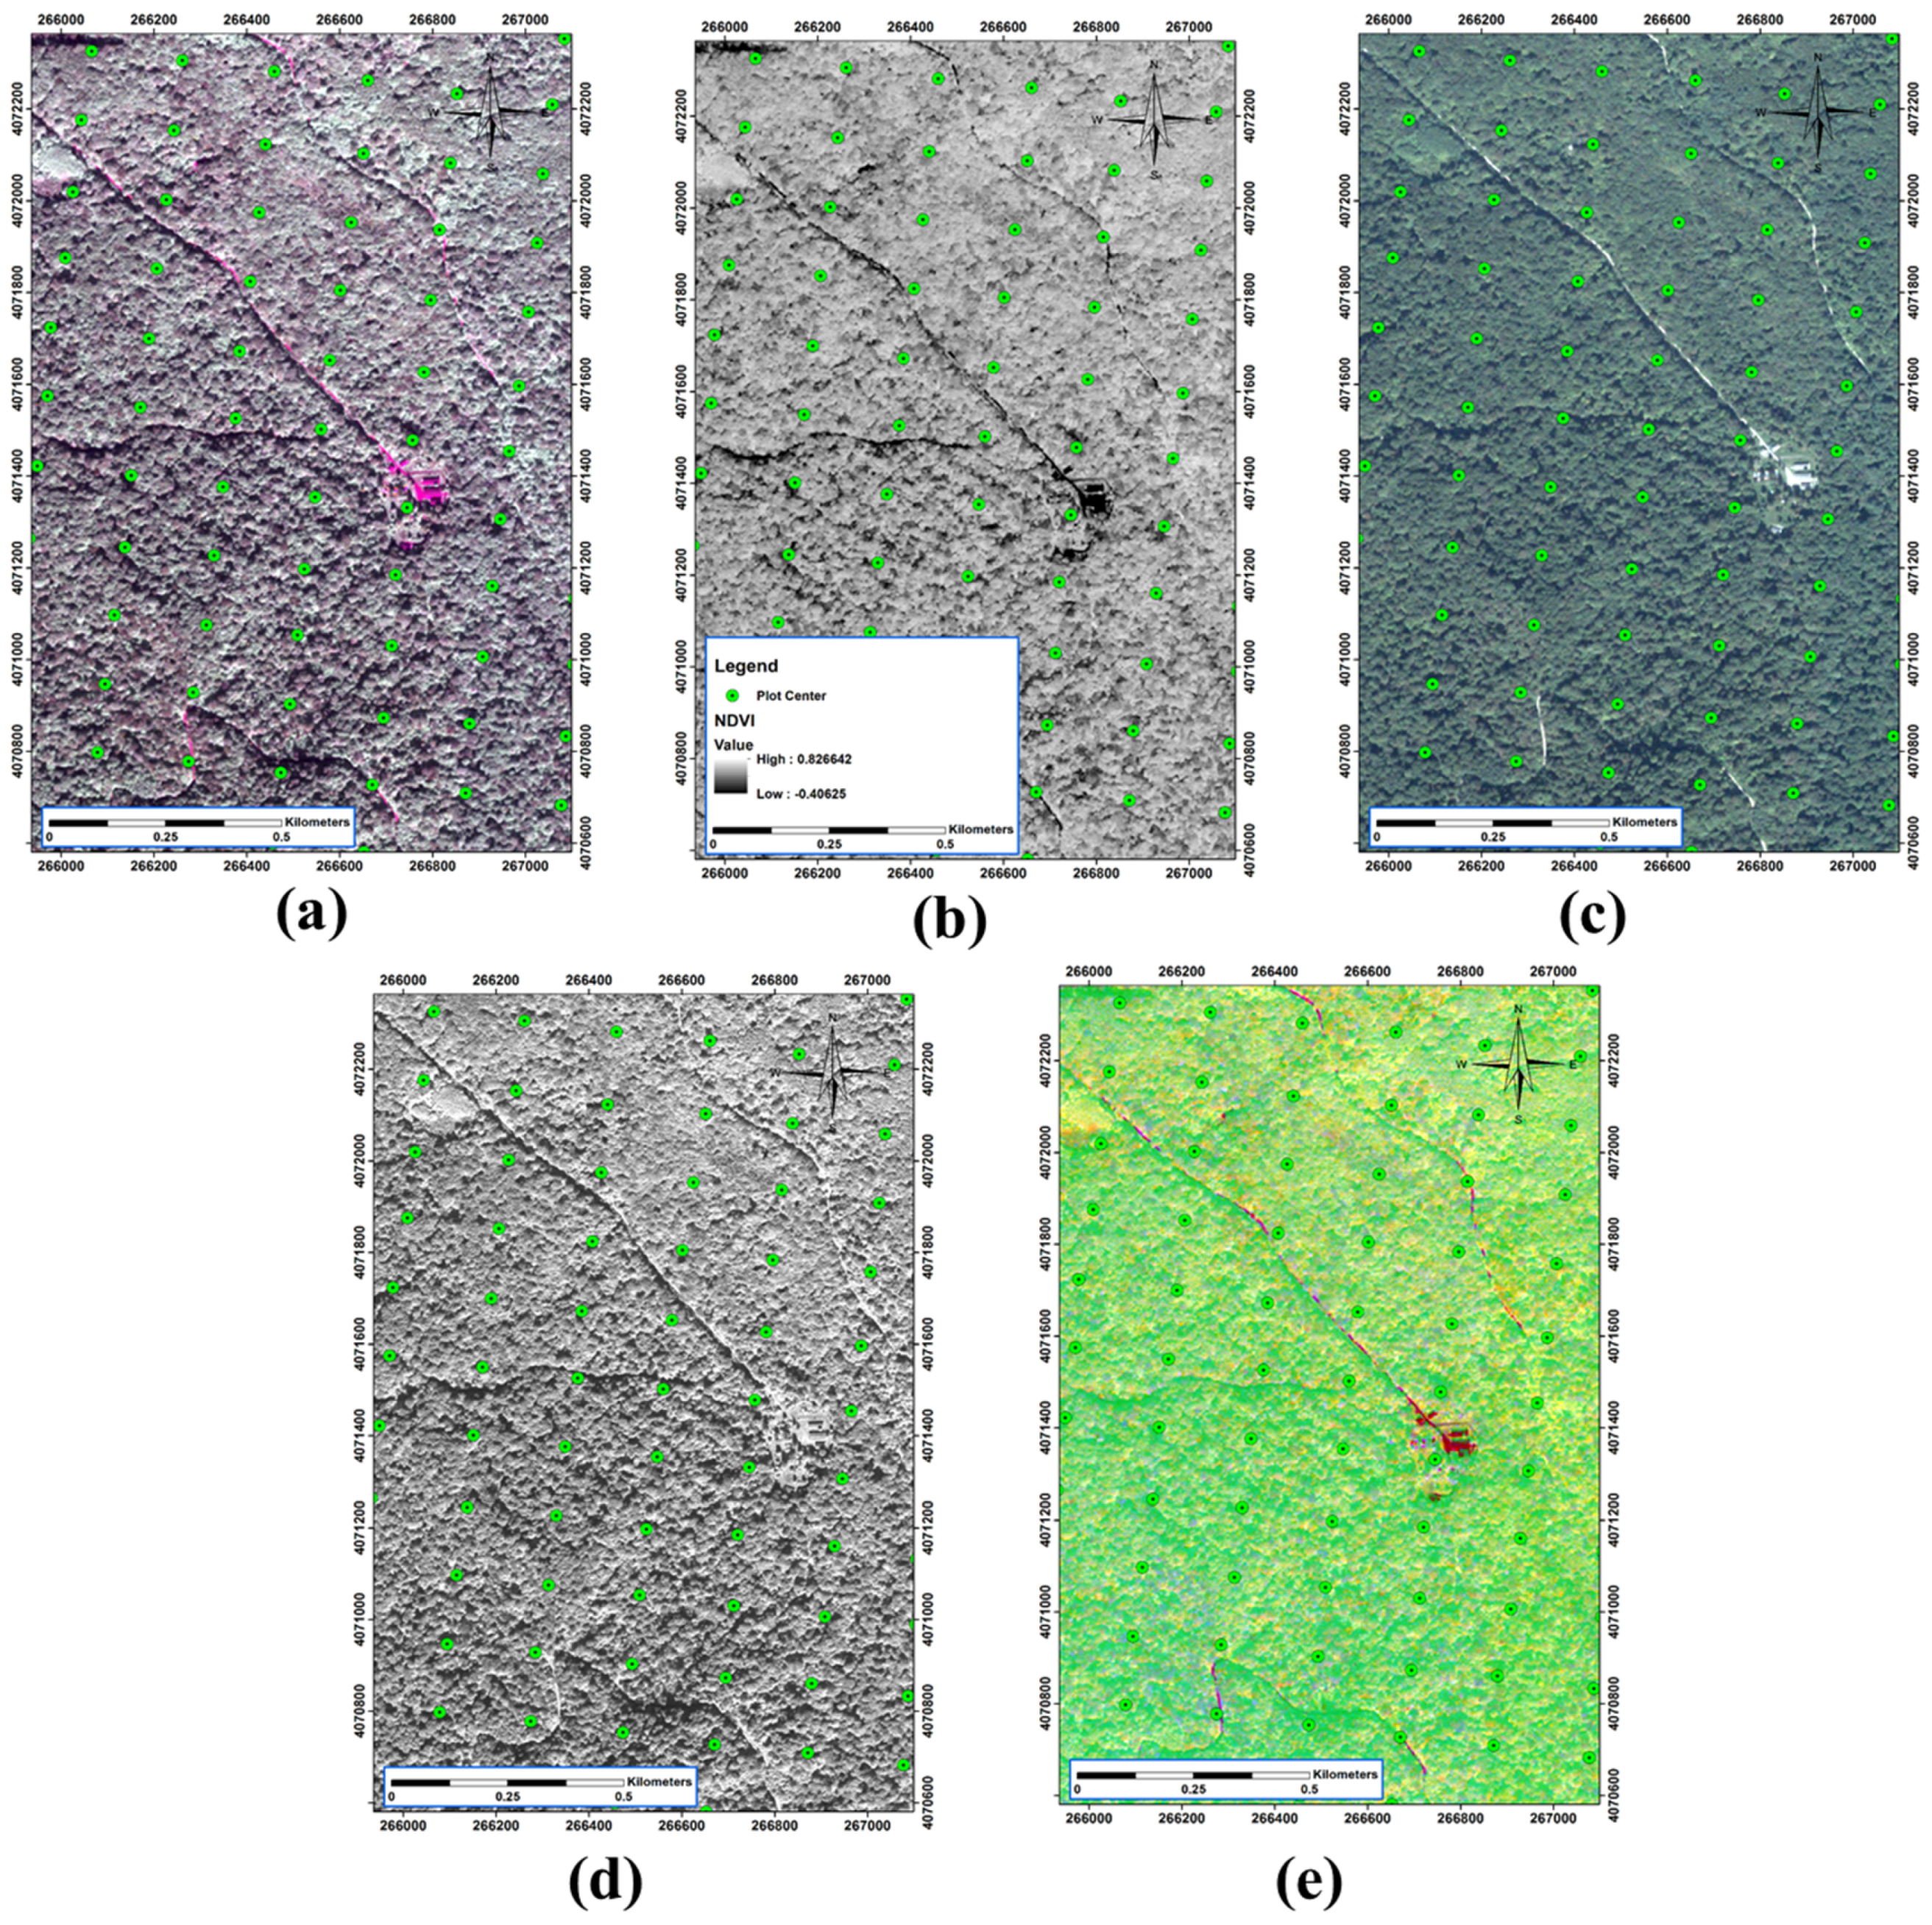
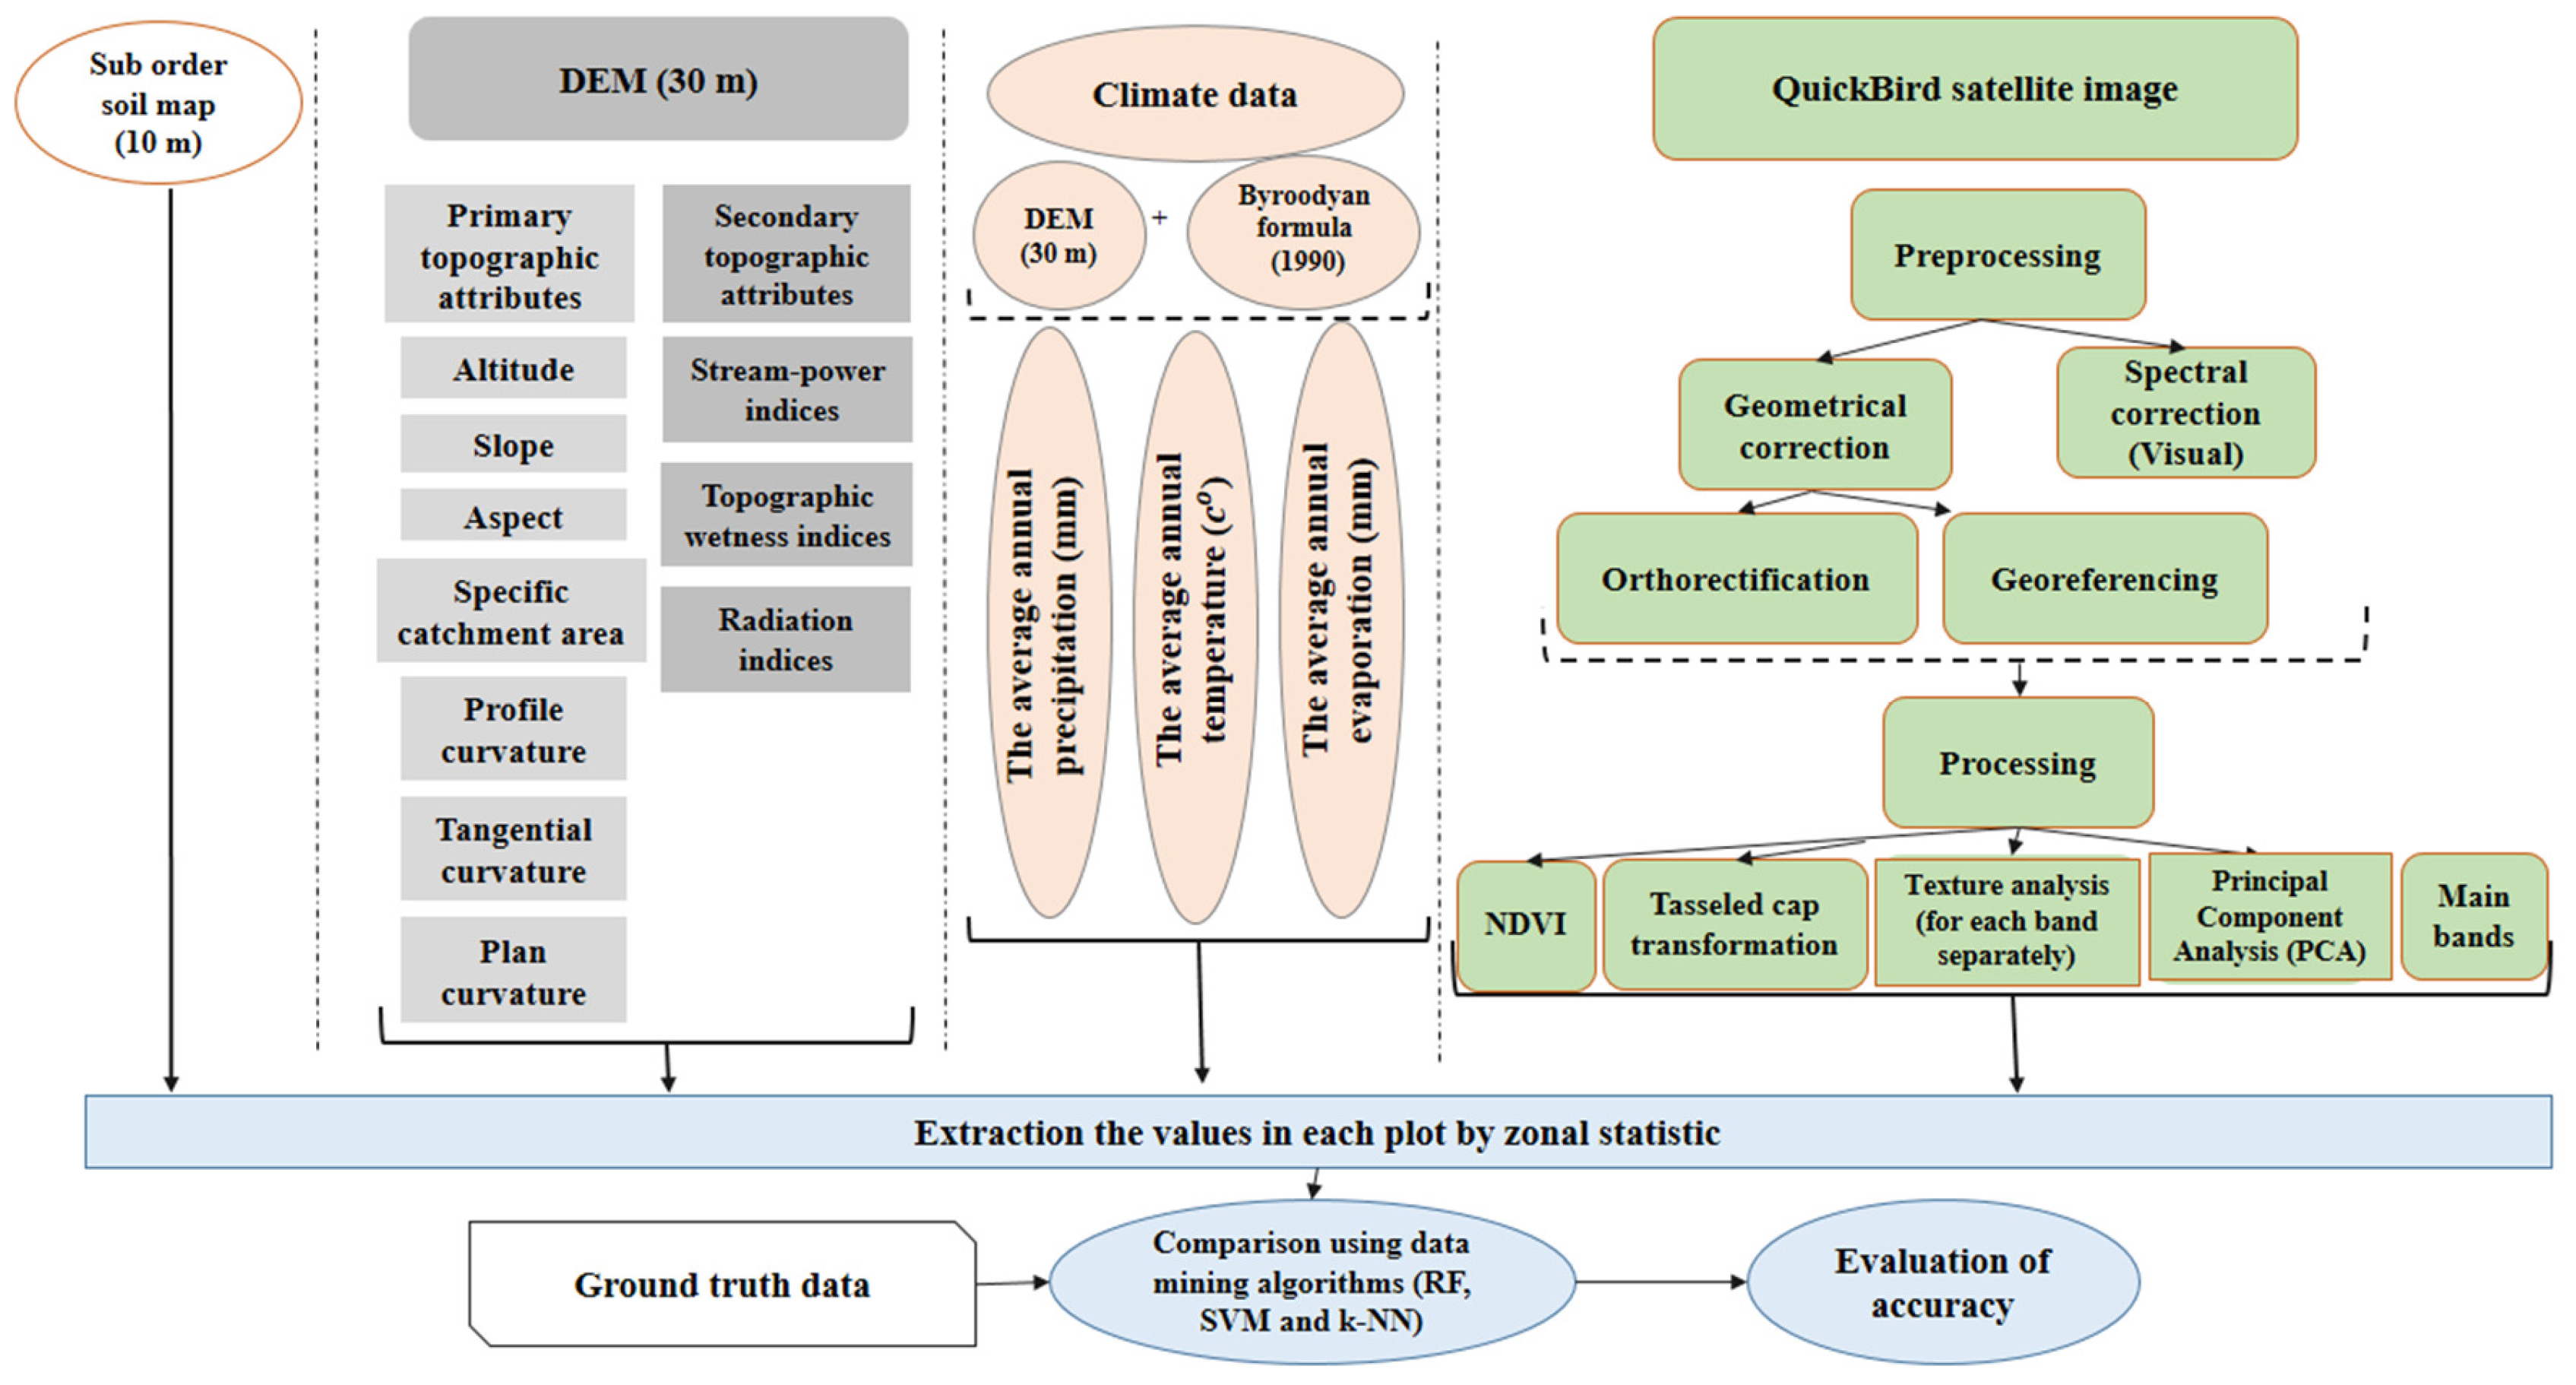
Modelling the spatial distribution of plants is one of the indirect methods for predicting the properties of plants and can be defined based on the relationship between the spatial distribution of vegetation and environmental variables. In this article, we introduce a new method for the spatial prediction of the dominant trees and species, through a combination of environmental and satellite data. Based on the basal area factor (BAF) frequency for each tree species in a total of 518 sample plots, the dominant tree species were determined for each plot. Also, topographical maps of primary and secondary properties were prepared using the digital elevation model (DEM). Categories of soil and the climate maps database of the Doctor Bahramnia Forestry Plan were extracted as well. After pre-processing and processing of spectral data, the pixel values at the sample locations in all the independent factors such as spectral and non-spectral data, were extracted. The modelling rates of tree and shrub species diversity using data mining algorithms of 80% of the sampling plots were taken. Assessment of model accuracy was conducted using 20% of samples and evaluation criteria. Random forest (RF), support vector machine (SVM) and k-nearest neighbor (k-NN) algorithms were used for spatial distribution modelling of dominant species groups using environmental and spectral variables from 80% of the sample plots. Results showed physiographic factors, especially altitude in combination with soil and climate factors as the most important variables in the distribution of species, while the best model was created by the integration of physiographic factors (in combination with soil and climate) with an overall accuracy of 63.85%. In addition, the results of the comparison between the algorithms, showed that the RF algorithm was the most accurate in modelling the diversity. View Full-Text
Keywords: spatial distribution; dominant tree species; topography; climate; soil; QuickBird; non-parametric algorithms
▼ Figures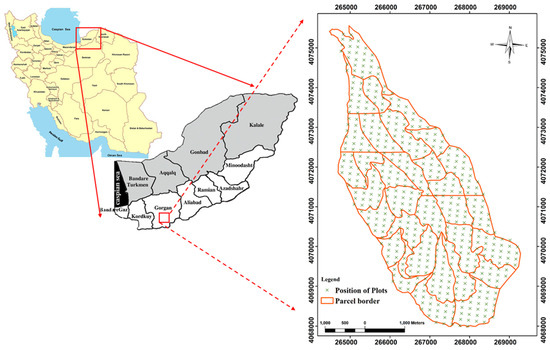
Figure 1
This is an open access article distributed under the Creative Commons Attribution License which permits unrestricted use, distribution, and reproduction in any medium, provided the original work is properly cited. (CC BY 4.0).
For further details log on website :
http://www.mdpi.com/1999-4907/8/2/42


No comments:
Post a Comment