Remote Sens. 2011, 3(4), 816-835; doi:10.3390/rs3040816
Author
1
International Rice Research Institute, Los Baños, 4031, Philippines
2
Southwest Geographic Science Center, US Geological Survey (USGS), Flagstaff, AZ 86001, USA
3
Japan International Research Center for Agricultural Sciences, 1-1, Ohwashi, Tsukuba 305-8686, Japan
4
United Nations Joint Logistic Center, World Food Program (WFP), Juba, South Sudan, Sudan
5
Ghana Irrigation Development Authority (GIDA), Accra, 00233, Ghana
*
Author to whom correspondence should be addressed.
Received: 5 February 2011 / Revised: 30 March 2011 / Accepted: 30 March 2011 / Published: 15 April 2011
Abstract
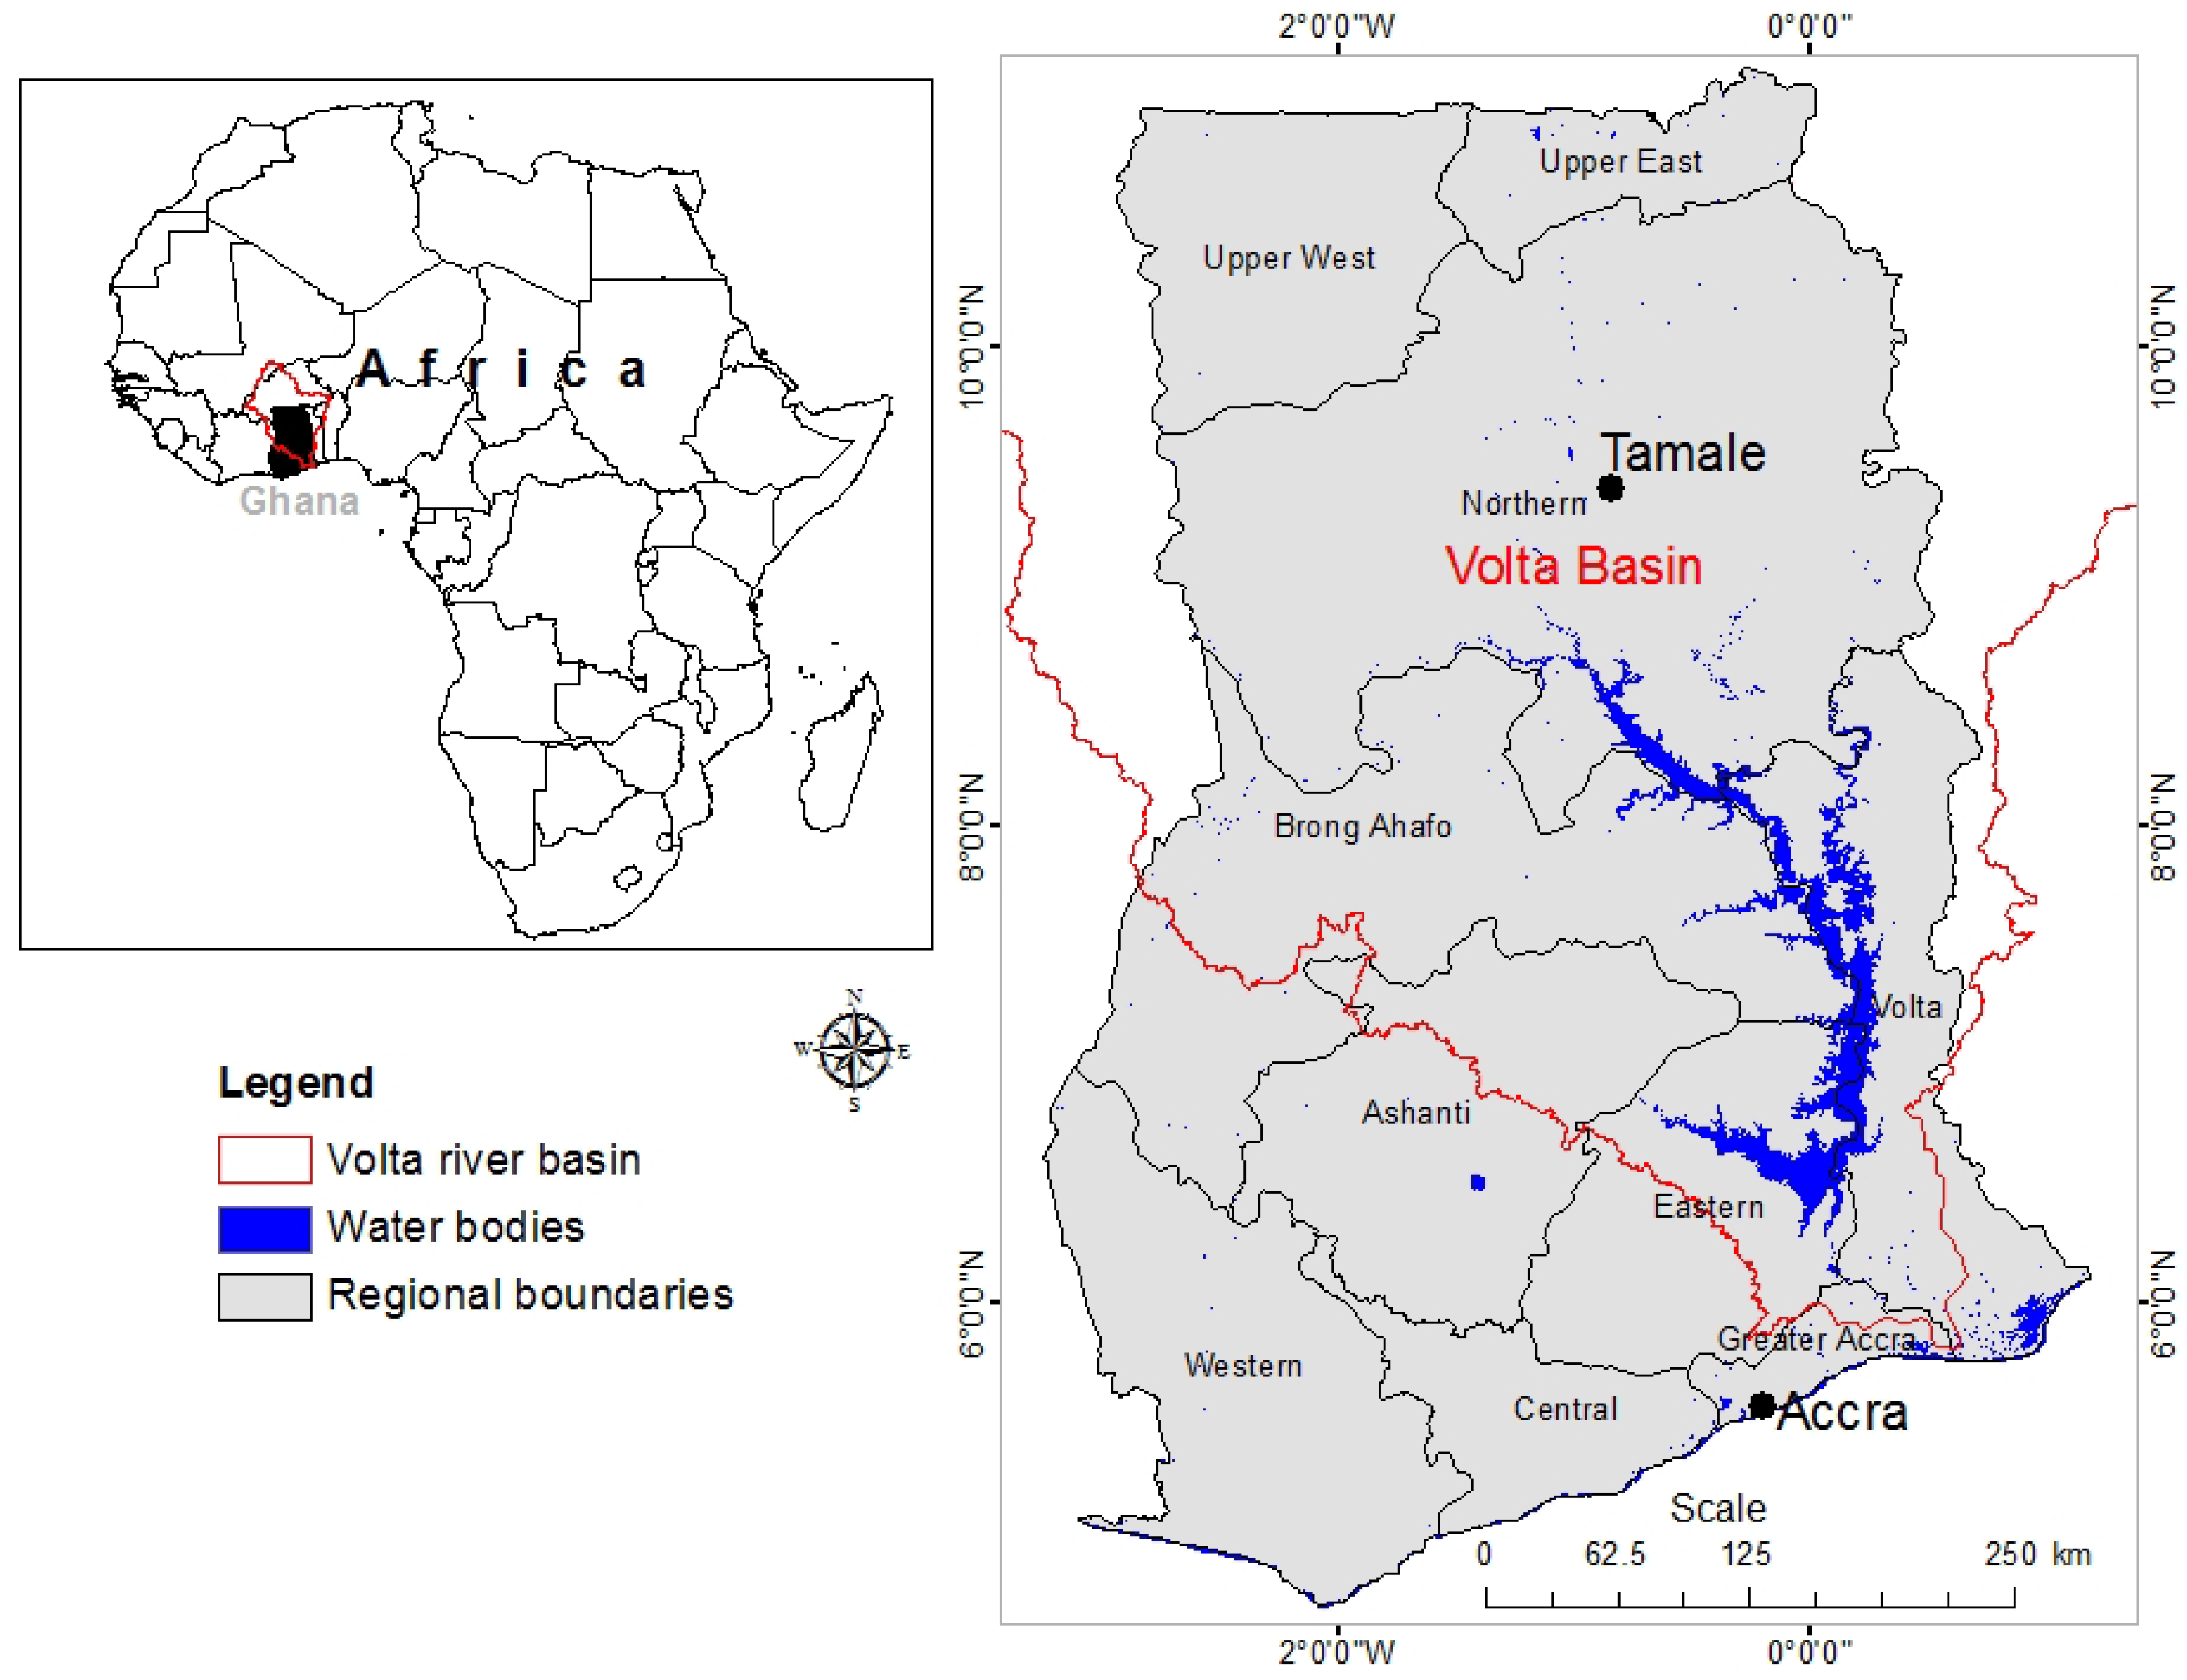
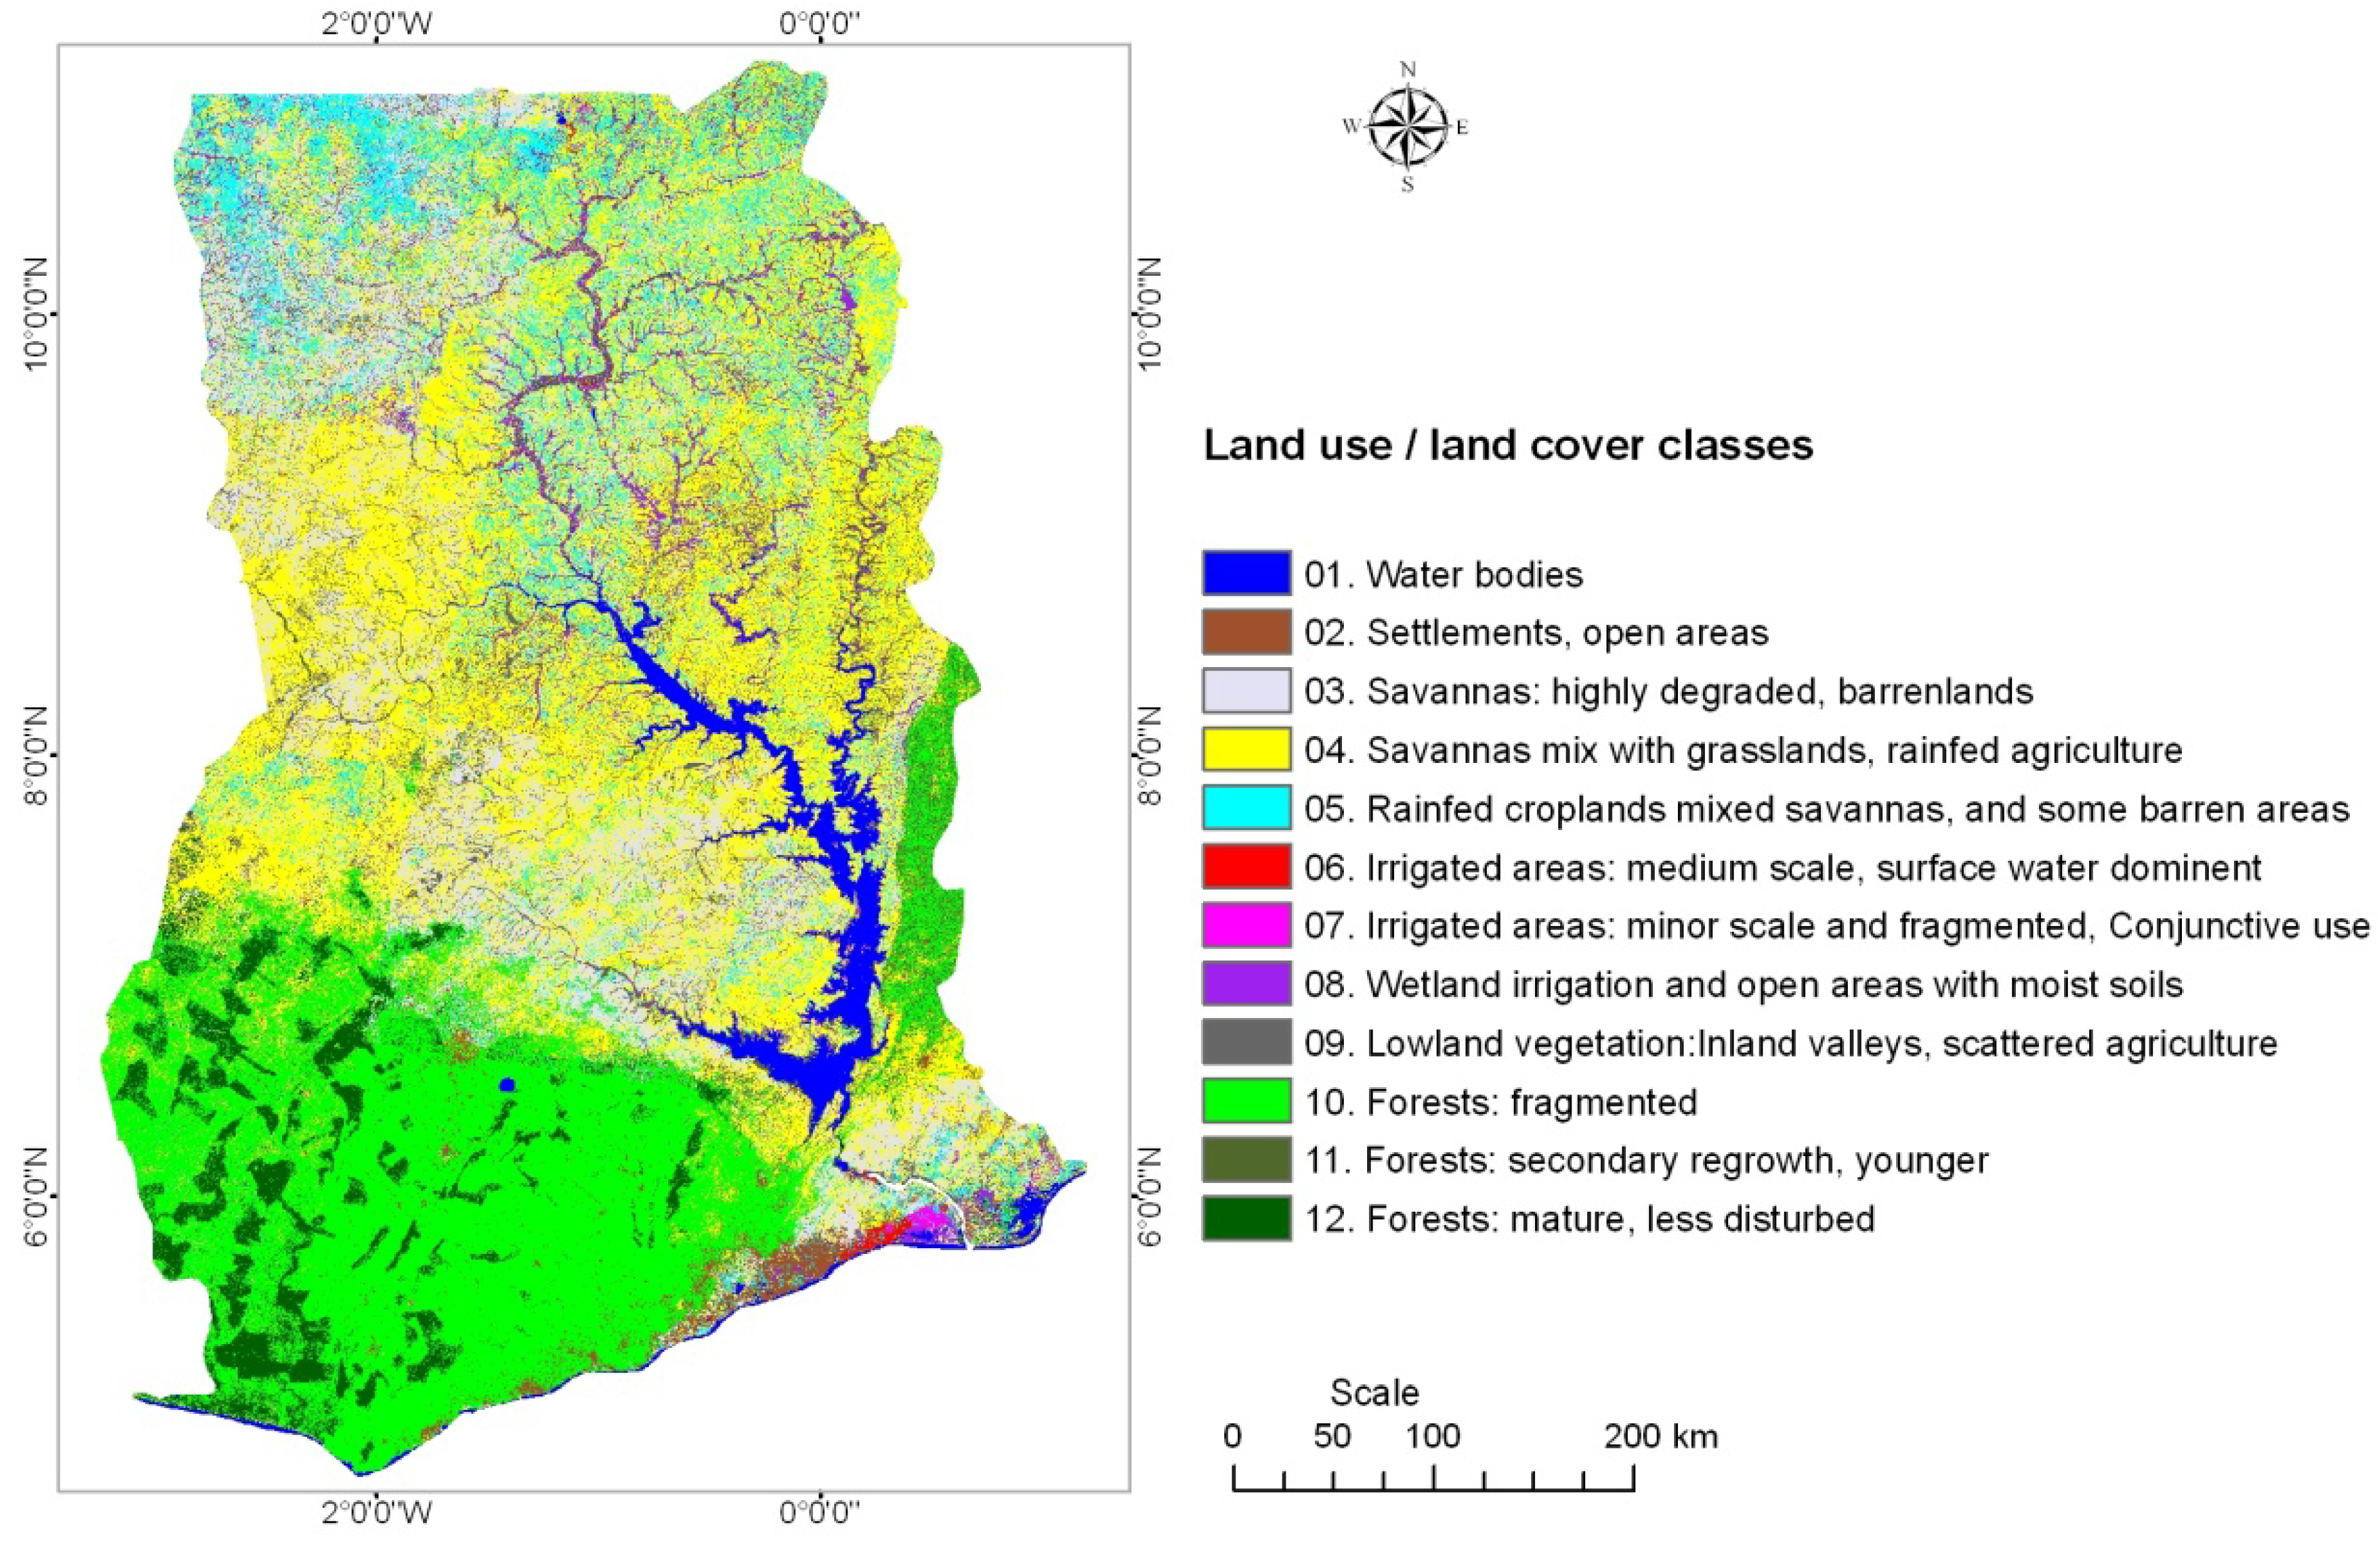
Maps of irrigated areas are essential for Ghana’s agricultural development. The goal of this research was to map irrigated agricultural areas and explain methods and protocols using remote sensing. Landsat Enhanced Thematic Mapper (ETM+) data and time-series Moderate Resolution Imaging Spectroradiometer (MODIS) data were used to map irrigated agricultural areas as well as other land use/land cover (LULC) classes, for Ghana. Temporal variations in the normalized difference vegetation index (NDVI) pattern obtained in the LULC class were used to identify irrigated and non-irrigated areas. First, the temporal variations in NDVI pattern were found to be more consistent in long-duration irrigated crops than with short-duration rainfed crops due to more assured water supply for irrigated areas. Second, surface water availability for irrigated areas is dependent on shallow dug-wells (on river banks) and dug-outs (in river bottoms) that affect the timing of crop sowing and growth stages, which was in turn reflected in the seasonal NDVI pattern. A decision tree approach using Landsat 30 m one time data fusion with MODIS 250 m time-series data was adopted to classify, group, and label classes. Finally, classes were tested and verified using ground truth data and national statistics. Fuzzy classification accuracy assessment for the irrigated classes varied between 67 and 93%. An irrigated area derived from remote sensing (32,421 ha) was 20–57% higher than irrigated areas reported by Ghana’s Irrigation Development Authority (GIDA). This was because of the uncertainties involved in factors such as: (a) absence of shallow irrigated area statistics in GIDA statistics, (b) non-clarity in the irrigated areas in its use, under-development, and potential for development in GIDA statistics, (c) errors of omissions and commissions in the remote sensing approach, and (d) comparison involving widely varying data types, methods, and approaches used in determining irrigated area statistics using GIDA and remote sensing. Extensive field campaigns to help in better classification and validation of irrigated areas using high (30 m ) to very high (<5 m) resolution remote sensing data that are fused with multi temporal data like MODIS are the way forward. This is especially true in accounting for small yet contiguous patches of irrigated areas from dug-wells and dug-outs. View Full-Text
Keywords: irrigated areas; MODIS; Landsat ETM+; Ghana; NDVI
This is an open access article distributed under the Creative Commons Attribution License (CC BY 3.0).
For further details log on website :
http://www.mdpi.com/2072-4292/3/4/816?utm_source=TrendMD&utm_medium=cpc&utm_campaign=Remote_Sens_TrendMD_0


No comments:
Post a Comment